Pysimplegui 简明教程
PySimpleGUI - Matplotlib Integration
当在 Python shell 中使用 Matplotlib 时,图表将显示在一个默认窗口中。 backend_tkagg 模块可用于将图表嵌入到 Tkinter 中。
When Matplotlib is used from Python shell, the plots are displayed in a default window. The backend_tkagg module is useful for embedding plots in Tkinter.
PySimpleGUI 中的 Canvas 元素具有返回原始 TKinter Canvas 对象的 TKCanvas 方法。在 backend_tkagg 模块中将其提供给 FigureCanvasTkAgg() 函数以绘制图形。
The Canvas element in PySimpleGUI has TKCanvas method that returns original TKinter’s Canvas object. It is given to the FigureCanvasTkAgg() function in the backend_tkagg module to draw the figure.
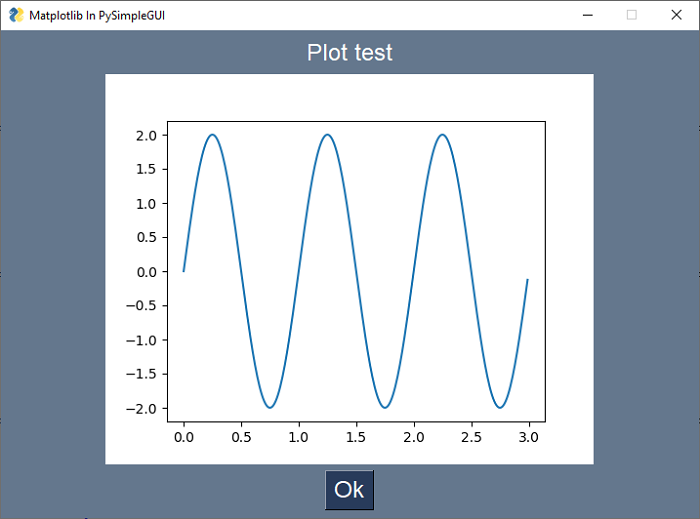
首先,我们需要使用 Figure() 类和一个绘图创建一个图形对象。我们将绘制一个显示正弦波的简单图表。
First, we need to create the figure object using the Figure() class and a plot to it. We shall draw a simple plot showing sine wave.
fig = matplotlib.figure.Figure(figsize=(5, 4), dpi=100)
t = np.arange(0, 3, .01)
fig.add_subplot(111).plot(t, 2 * np.sin(2 * np.pi * t))
定义一个函数,在画布上绘制 matplotlib 图形对象
Define a function to draw the matplotlib figure object on the canvas
def draw_figure(canvas, figure):
   figure_canvas_agg = FigureCanvasTkAgg(figure, canvas)
   figure_canvas_agg.draw()
   figure_canvas_agg.get_tk_widget().pack(side='top', fill='both', expand=1)
   return figure_canvas_agg
通过调用其 TkCanvas 属性,从 PySimpleGUI.Canvas 对象获取画布。
Obtain the Canvas from PySimpleGUI.Canvas object by calling its TkCanvas property.
layout = [
   [psg.Text('Plot test')],
   [psg.Canvas(key='-CANVAS-')],
   [psg.Button('Ok')]
]
调用上述函数绘制图形。将画布对象和图形对象传递给它。
Draw the figure by calling the above function. Pass the Canvas object and fifure object to it.
fig_canvas_agg = draw_figure(window['-CANVAS-'].TKCanvas, fig)Example: Draw a Sinewave Line graph
以下是完整代码 −
The complete code is given below −
import matplotlib.pyplot as plt
import numpy as np
from matplotlib.backends.backend_tkagg import
FigureCanvasTkAgg
import PySimpleGUI as sg
import matplotlib
matplotlib.use('TkAgg')
fig = matplotlib.figure.Figure(figsize=(5, 4), dpi=100)
t = np.arange(0, 3, .01)
fig.add_subplot(111).plot(t, 2 * np.sin(2 * np.pi * t))
def draw_figure(canvas, figure):
   tkcanvas = FigureCanvasTkAgg(figure, canvas)
   tkcanvas.draw()
   tkcanvas.get_tk_widget().pack(side='top', fill='both', expand=1)
   return tkcanvas
layout = [[sg.Text('Plot test')],
   [sg.Canvas(key='-CANVAS-')],
   [sg.Button('Ok')]]
window = sg.Window('Matplotlib In PySimpleGUI', layout, size=(715, 500), finalize=True, element_justification='center', font='Helvetica 18')

# add the plot to the window
tkcanvas = draw_figure(window['-CANVAS-'].TKCanvas, fig)
event, values = window.read()
window.close()
生成的图表如下 −
The generated graph is as follows −