Aws Quicksight 简明教程
AWS Quicksight - Overview
AWS Quicksight 是最强大的商业智能工具之一,它允许您在数分钟内创建交互式仪表板,以便为组织提供商业见解。有许多可视化或图形格式可用于创建仪表板。仪表板会随着数据更新或计划自动更新。您还可以将 Quicksight 中创建的仪表板嵌入到您的 Web 应用程序中。
AWS Quicksight is one of the most powerful Business Intelligence tools which allows you to create interactive dashboards within minutes to provide business insights into the organizations. There are number of visualizations or graphical formats available in which the dashboards can be created. The dashboards get automatically updated as the data is updated or scheduled. You can also embed the dashboard created in Quicksight to your web application.
通过最新的 ML 见解,又名机器学习见解,Quicksight 使用其内置算法找出历史数据中的任何异常或峰值。这样可以帮助根据这些见解提前准备好业务需求。以下是 Quicksight 入门快速指南。
With the latest ML insights, also known as Machine Learning insights, Quicksight uses its inbuilt algorithms to find any kind of anomalies or peaks in the historical data. This helps to get prepared with the business requirements ahead of time based on these insights. Here is quick guide to get started with Quicksight.
以下是 AWS 的官方产品说明页面-
Below is official product description page from AWS −
您还可以通过填写下面提到的信息并单击 Continue 按钮来订阅 AWS 试用帐户。
You can also subscribe for an AWS trial account by filling the below mentioned information and click on Continue button.

AWS Quicksight - Landing Page
要访问 AWS Quicksight 工具,您可以直接通过在 Web 浏览器中传递此 URL 或导航至 AWS Console → Services 来直接打开它
To access AWS Quicksight tool, you can open it directly by passing this URL in web browser or navigating to AWS Console → Services
打开此 URL 后,在右上角单击 “Sign in to the Console” 。
Once you open this URL, on top right corner click on “Sign in to the Console”.

您需要提供以下详细信息才能登录到 Quicksight 工具 -
You need to provide the below details to login to Quicksight tool −
-
Account ID or alias
-
IAM User name
-
Password

登录到 Quicksight 后,您将看到以下屏幕 -
Once you login into Quicksight, you will see the below screen −

如上图所示,
As marked in the above image,
Section A - “新建分析”图标用于创建一个新分析。当您单击它时,它会要求您选择任何数据集。您还可以创建一个新的数据集,如下所示 -
Section A − “New Analysis” icon is used to create a new analysis. When you click on this, it will ask you to select any data set. You can also create a new data set as shown below −

Section B - “管理数据”图标将显示已经输入 Quicksight 的所有数据集。此选项可用于管理数据集,而无需创建任何分析。
Section B − The “Manage data” icon will show all the data sets that have already been input to Quicksight. This option can be used to manage the dataset without creating any analysis.
Section C − 它显示了您已经连接的各种数据源。您也可以连接到新的数据源或上传文件。
Section C − It shows various data sources you have already connected to. You can also connect to a new data source or upload a file.

Section D − 此部分包含用于已创建的分析、已发布的仪表盘和详细说明 Quicksight 的教程视频的图标。
Section D − This section contains icon for already created analysis, published dashboards and tutorial videos explaining about Quicksight in detail.
您可以单击每个标签以将其查看如下 −
You can click on each tab to view them as below −
All analysis
在这里,您可以看到 AWS Quicksight 帐户中的所有现有分析,包括报表和仪表盘。
Here, you can see all the existing analysis in AWS Quicksight account including report and dashboards.

All dashboards
此选项仅显示 AWS Quicksight 帐户中的现有仪表盘。
This option shows only existing dashboards in AWS Quicksight account.

Tutorial videos

使用以下 URL 导航到 AWS 控制台是打开 Quicksight 控制台的另一种选择 −
Other option to open Quicksight console is by navigating to AWS console using below URL −
登录后,您需要导航到“服务”标签,并在搜索栏中搜索 Quicksight。如果您最近在 AWS 帐户中使用了 Quicksight 服务,它将显示在“历史记录”标签下。
Once you login, you need to navigate to Services tab and search for Quicksight in search bar. If you have recently used Quicksight services in AWS account, it will be seen under History tab.

AWS Quicksight - Using Data Sources
AWS Quicksight 接受来自各种来源的数据。一旦在主页上单击“新数据集”,它就会提供所有可用于的数据源选项。
AWS Quicksight accepts data from various sources. Once you click on “New Dataset” on the home page, it gives you options of all the data sources that can be used.
以下是包含所有内部和外部源列表的源−
Below are the sources containing the list of all internal and external sources −

让我们通过 Quicksight 连接一些最常用的数据源−
Let us go through connecting Quicksight with some of the most commonly used data sources −
Uploading a file from system
它只允许你输入 .csv、.tsv、.clf、.elf.xlsx 和 Json 格式文件。一旦你选择文件,Quicksight 会自动识别文件并显示数据。当你单击 Upload a File 按钮时,需要提供要用于创建数据集的文件位置。
It allows you to input .csv, .tsv, .clf,.elf.xlsx and Json format files only. Once you select the file, Quicksight automatically recognizes the file and displays the data. When you click on Upload a File button, you need to provide the location of file which you want to use to create dataset.
Using a file from S3 format
屏幕将如下显示。在数据源名称下,你可以输入要为所创建数据集显示的名称。此外,可能需要从本地系统上载清单文件或提供清单文件的 S3 位置。
The screen will appear as below. Under Data source name, you can enter the name to be displayed for the data set that would be created. Also you would require either uploading a manifest file from your local system or providing the S3 location of the manifest file.

清单文件是 JSON 格式文件,用于指定输入文件及其格式的 URL/位置。你可以输入多个输入文件(前提是格式相同)。以下是一个清单文件的示例。用于传递输入文件位置的“URI”参数是 S3。
Manifest file is a json format file, which specifies the url/location of input files and their format. You can enter more than one input files, provided the format is same. Here is an example of a manifest file. The “URI” parameter used to pass the location of input file is S3.
{
   "fileLocations": [
      {
         "URIs": [
            "url of first file",
            "url of second file",
            "url of 3rd file and so on"
         ]
      },

   ],
}
"globalUploadSettings": {
   "format": "CSV",
   "delimiter": ",",
   "textqualifier": "'",
   "containsHeader": "true"
}
globalUploadSettings 中传入的参数是默认参数。您可以根据您的要求更改这些参数。
The parameters passed in globalUploadSettings are the default ones. You can change these parameters as per your requirements.
MySQL
您需要在字段中输入数据库信息,以连接到您的数据库。一旦连接到您的数据库,您便可以从其中导入数据。
You need to enter the database information in the fields to connect to your database. Once it is connected to your database, you can import the data from it.

当您连接到任何 RDBMS 数据库时,需要以下信息−
Following information is required when you connect to any RDBMS database −
-
DSN name
-
Type of connection
-
Database server name
-
Port
-
Database name
-
User name
-
Password
以下是 Quicksight 中支持的基于 RDBMS 的数据源−
Following RDBMS based data sources are supported in Quicksight −
-
Amazon Athena
-
Amazon Aurora
-
Amazon Redshift
-
Amazon Redshift Spectrum
-
Amazon S3
-
Amazon S3 Analytics
-
Apache Spark 2.0 or later
-
MariaDB 10.0 or later
-
Microsoft SQL Server 2012 or later
-
MySQL 5.1 or later
-
PostgreSQL 9.3.1 or later
-
Presto 0.167 or later
-
Snowflake
-
Teradata 14.0 or later
Athena
Athena 是 AWS 工具,用于对表运行查询。您可以在 Athena 中选择任意表,或对这些表运行自定义查询,并在 Quicksight 中使用这些查询的输出。选择数据源有几个步骤
Athena is the AWS tool to run queries on tables. You can choose any table from Athena or run a custom query on those tables and use the output of those queries in Quicksight. There are couple of steps to choose data source
当您选择 Athena 时,将出现以下屏幕。您可以输入您希望在 Quicksight 中向您的数据源提供的任何数据源名称。单击 “Validate Connection” 。验证连接后,单击 “Create new source” 按钮
When you choose Athena, below screen appears. You can input any data source name which you want to give to your data source in Quicksight. Click on “Validate Connection”. Once the connection is validated, click on the “Create new source” button

现在从下拉列表中选择表名。下拉列表将显示 Athena 中存在的数据库,该数据库将进一步显示该数据库中的表。此外,您还可以单击 “Use custom SQL” 以对 Athena 表运行查询。
Now choose the table name from the dropdown. The dropdown will show the databases present in Athena which will further show tables in that database. Else you can click on “Use custom SQL” to run query on Athena tables.

完成后,您可以单击 “Edit/Preview data” 或 “Visualize” 以编辑数据或根据您的要求直接可视化数据。
Once done, you can click on “Edit/Preview data” or “Visualize” to either edit your data or directly visualize the data as per your requirement.

Deleting a data source
当您删除在任何 Quicksight 仪表板中使用的某个数据源时,它可能会导致关联的数据集不可用。通常在您查询基于 SQL 的数据源时发生这种情况。
When you delete a data source which is in use in any of the Quicksight dashboards, it can make associated data set unusable. It usually happens when you query a SQL based data source.
当您基于 S3, Sales force or SPICE 创建数据集时,它不会影响您使用任何数据集的能力,因为数据存储在 SPICE 中;然而在这种情况下不可用刷新选项。
When you create a dataset based on S3, Sales force or SPICE, it does not affect your ability to use any dataset as data is stored in SPICE; however refresh option is not available in this case.
要删除某个数据源,请选择该数据源。在创建数据集页面上导航到“来自现有数据源”选项卡。
To delete a data source, select the data source. Navigate to From Existing Data Source tab on creating a dataset page.

在删除之前,您还可以确认预计表大小和数据源的其他详细信息。
Before deletion, you can also confirm estimated table size and other details of data source.

AWS Quicksight - Data Source Limit
当您在 Quicksight 工具中使用不同的数据源时,会根据数据源应用某些限制。
When you use different data sources in Quicksight tool, there are certain limits that apply based on data sources.
File
您最多可以使用清单文件中指定的大小 25 GB。此限制取决于导入到 SPICE 后的大小。
You can use up to 25GB of total size specified in manifest file. This limit is dependent on the file size after it is imported to SPICE.
清单文件中支持的文件数量为 1000,并且对每个文件中的列数也有一些限制。
The number of files supported in manifest file is 1000 and you also have some limit on number of columns in each file.
Table and Query
当您查询一个大表时,建议您使用 Where 或 Having 条件来减少导入到 SPICE 的数据数量。导入到 SPICE 中的查询结果不应超过 25 GB。
When you are querying a large table, it is recommended that you use Where or Having condition to reduce the number of data imported to SPICE. Query result imported into SPICE should not exceed 25 GB.
您可以在将数据导入 SPICE 时取消选择一些列。
You can deselect some of the columns while importing the data into SPICE.
如果您的数据源包含 Quicksight 不支持的数据类型,AWS Quicksight 会跳过这些值。
In case your data source contains data type which are not supported in Quicksight, AWS Quicksight skips those values.
Person ID |
Sales Date |
Amount |
001 |
10/14/2017 |
12.43 |
002 |
5/3/2017 |
25.00 |
003 |
Unknown |
18.17 |
004 |
3/8/2019 |
86.02 |
从以上值来看,在数据集导入这些数据时,Quicksight 将删除无日期值所在行。Quicksight 中支持以下数据类型-
From the above values, Quicksight will drop the no date value row while importing this data in dataset. Following data types are supported in Quicksight −
Database Source |
Number Data Types |
String Data Types |
Date time Data Types |
Boolean Data Types |
Amazon Athena,Presto |
bigintdecimaldoubleintegerrealsmallinttinyint |
charvarchar |
datetimestamp |
Boolean |
Amazon Aurora, MariaDB,and MySQL |
bigintdecimaldoubleintintegermediumintnumericsmallinttinyint |
charenumsettextvarchar |
datedatetimetimestampyear |
|
PostgreSQL |
bigintdecimaldoubleintegernumericprecisionrealsmallint |
charcharactertextvarcharvarying character |
datetimestamp |
Boolean |
Apache Spark |
bigintdecimaldoubleintegerrealsmallinttinyint |
varchar |
datetimestamp |
Boolean |
Snowflake |
bigintbyteintdecimaldoubledoubleprecisionfloatfloat4float8intintegernumbernumericrealsmallinttinyint |
charcharacterstringtextvarchar |
datedatetimetimetimestamptimestamp_* |
Boolean |
Microsoft SQL Server |
bigintbitdecimalintmoneynumericrealsmallintsmallmoneytinyint |
charncharnvarchartextvarchar |
datedatetimedatetime2datetimeoffsetsmalldatetime |
bit |
AWS Quicksight - Editing Datasets
当您创建一个用于 Quicksight 的新数据集时,将显示以下消息。您可以根据您的要求预览或编辑数据。您可以更改某些字段的类型,重命名标题或根据输入字段添加一些计算域。
When you create a new dataset to be used in Quicksight, the following message would appear. You can preview or edit the data as per your requirement. You can change the types of certain fields, rename the headers or add some calculated fields based on input fields.

点击“编辑/预览数据”后,您将能够看到输入数据集上的标题和字段。这是一个示例数据集 -
Once you click Edit/Preview data, you will be able to see the header and the fields on your input dataset. Here is a sample dataset −

还有一个添加计算字段的选项。您可以在输入字段上使用内置函数来创建新字段。有多种选项,如连接多个字段、将单个字段解构为多个字段、两日期间的时间差等等。完整列表如下所示 -
There is an option of adding calculated fields as well. You can use inbuilt functions on input fields to create a new field. There are number of options like concatenating multiple fields, unstring a single field into multiple fields, time difference between to dates and so on. The complete list is shown below −

完成添加或修改字段后,只需单击顶部的“保存并可视化”或“保存”即可。“保存”按钮将保留您在现有屏幕上,而“保存并可视化”将带您到可视化创建屏幕。
Once you are done with adding or modifying fields, just click “Save and Visualize” or just “Save” at the top. The “Save” button will keep you on existing screen while “Save and Visualize” will take you to the visual creation screen.

要取消更改,请单击顶部的“取消”按钮。
To cancel your changes, click on Cancel button at the top.
AWS Quicksight - Creating New Analysis
分析是多个可视化效果的组合。可视化效果以图形、图表或表格形式表示数据。有许多格式可用于创建任何可视化效果。这包括饼图、水平条形图、垂直条形图和数据透视表。
An analysis is a combination of one or more visuals. A visual is the representation of data in graphical, chart or tabular format. There are number of formats available to create any visual. This includes the pie charts, horizontal bar chart, vertical bar chart and pivot table.
根据业务需求修改输入数据集后,双击数据集并单击“可视化”以开始创建新的分析。它将向您显示以下屏幕或工作区。
Once the input data set has been modified as per business requirement, double click on the dataset and click on visualize to start creating new analysis. It will show you the below screen or the workspace.

选择字段后,Quicksight 会根据该字段自动选择可视化类型。如果您想更改可视化类型,则可以选择一种可视化类型。
Once you select a field, Quicksight automatically chooses the type of visual depending upon the field. If you want to change the visual type, you can select one of the visual types.
例如,我们从在可视化类型下选择“水平条形图”开始。首先,将任意一个字段拖到中心的可视化效果内。顶部,您将看到包含在可视化效果和对应轴中使用的字段的“字段井”。您可以在用户名正下方最后一个位置单击向下箭头。
For example, we start by selecting the Horizontal bar under visual types. First, drag any one field inside the visual in the centre. At the top, you will see “Fields wells” containing fields used in visual and the corresponding axis. You can click on the down arrow at the last just under user name.

这将为您提供展开的视图。我在 Y 轴上选择了“性别”,在“组/颜色”下选择了“工作组”。您可以从下拉列表中修改字段。在“值”下,您可以添加任何数字字段并在该字段上使用聚合函数。默认情况下,可视化效果将显示行数。
This will give you an expanded view. I have selected Gender on Y axis and Job family under Group/colour. You can modify the fields from dropdown. Under value, you can add any numeric field and use aggregate function on that field. By default, the visual will show count of rows.


可视化效果将如下显示 −
The visual will appear as follows −

有选项可以更改可视化效果的标题/标题以及其他格式化选项。单击最右侧的下拉列表。选项将展开。选择“格式化可视化效果”。您将能够在“格式化可视化效果”下看到左侧选项卡中的各种选项。
There are options to change the heading/title of the visual and number of other formatting options. Click the dropdown on the right most. The options will expand. Choose “format visual”. You will be able to see various options in left tab under “Format visual”.

X-Axis/Y-Axis − 如果您想在各自的轴上看到标签或字段名称,这将提供选项。它还允许您重命名这些标签。
X-Axis/Y-Axis − This gives the option if you want to see the label or field name on the respective axis. It also allows you to rename these labels.
Group/Color − 此选项能够更改视觉元素中的默认颜色。
Group/Color − This provides the option to change the default colors in the visual.
Legend − 此选项能够更改视觉元素中标题的标题和位置。你也可以仅仅通过点击标题来重命名标题。
Legend − This provides the options to change title and position of title in the visual. You can also rename the title by just clicking over it.
Data labels − 此选项能够显示每个条形的确切值以及值需要显示的位置。
Data labels − This provides the option to show exact values of each bar and the position where the values needs to be displayed.
以下屏幕显示的视觉元素已全部打开−
The below screen shows the visual with everything turned on −

AWS Quicksight - Adding Visuals
要添加新的可视化效果,请单击顶部中的 “Add” 标志。将向分析中添加另一个矩形空间。您可以选择不同的可视化类型和字段来创建另一个可视化效果。
To add a new visual, click on the “Add” sign at the top. Another rectangular space would be added to the analysis. You can select different visual types and fields to create another visual.

当您单击“添加”按钮时,您可以选择将以下内容添加到现有分析中 −
When you click on Add button, you have the option to add following to your existing analysis −
-
Add Visual
-
Add Insight
-
Add Title
-
Add Description
-
Add Calculation Field
-
Add Parameter

要设置可视化效果的格式,您也可以使用图表右上角提供的下拉箭头按钮。提供以下选项 −
To format a visual, you can also use drop down arrow button available at top right corner of the chart. Following options are available −
-
Maximize
-
Format visual
-
Hide legend
-
Export to CSV
-
Hide “other” categories
-
URL actions
-
Delete

AWS Quicksight - Using Filters to a Visual
Quicksight 允许您将筛选器添加到正在创建的可视化内容中。您可以选择仅对任何分析下方的一个可视化内容或所有可视化内容应用筛选器。要添加筛选器,请单击左标签上的“筛选器”图标。如果存在任何现有筛选器,它将显示,或者可以根据要求创建筛选器。在以下示例中,我们没有任何现有筛选器,因此它提供了一个“创建一个”选项
Quicksight allows you to add filters to the visual being created. You have the option to apply filter to only a single visual under any analysis or all the visuals. To add filter, click on “Filter” icon on the left tab. It will show existing filter if there is any or filter can be created as per the requirement. In the below example, we don’t have any existing filters, so it gave an option to “Create one”

单击“创建一个”时,您可以创建筛选器。这允许您选择是要仅将筛选器添加到一个可视化内容还是所有可视化内容。它还允许您选择要应用筛选器的字段。
On clicking create one, you can create filter. This allows you to choose if you want to add filter to just one or all the visuals. It also allows you to choose the field on which you want to apply filter.

在上面的示例中,我们在输入数据集的“出生日期”字段上添加了筛选器,并指定了日期。现在,可视化内容中包含了不同职务级别和职务类型的员工的平均任期,但仅包括出生日期在 1980-01-01 之后的员工。
In the above example, we have added a filter on “Date of Birth” field on input dataset and specified a Date. Now, the visual contains the average tenure of employees under different job level and job family but only including employees whose Date of Birth is after 1980-01-01.
AWS Quicksight - Insights
亚马逊利用其机器学习能力分析数据并提供见解。见解显示了数据中的趋势,帮助预测业务指标并确定关键驱动因素。它节省了大量手动分析和创建的时间。借助于见解,你可以轻松了解各种要点,有助于你确定最佳决策并实现目标。
Amazon uses its machine learning capabilities to analyze your data and provide insights. The insights show you the trends in the data, help in forecasting business metrics and identify key drivers. It saves lot of your time to analyze and create them manually. With the help of insights, you can easily understand various points which help you to determine and make best decisions, and achieve your goals.
一旦单击见解,左侧面板将在“建议见解”下显示 Quicksight 自动计算并创建的见解。
Once you click on the Insights, the left panel displays the automatically calculated and created insights by Quicksight under “Suggested Insights

如果将鼠标悬停在每个见解标题的右侧,将会看到一个“”号和三个点。“”号用于向分析中添加见解,而三个点则提供了向现有见解添加筛选器的选项。若要添加见解,单击顶部的“添加”号并单击“添加见解”。
If you hover on the right of each insight heading, you will see a “” sign and 3 dotes. The “” sign is used to add the insight to your analysis while the 3 dotes gives you option to add in filters to existing insights. To add an insight, click on the “Add” sign at the top and click on “Add insights”.
你可以进一步选择想要执行的计算类型并将该见解添加到分析中。“预测”和异常检测均由机器学习提供支持,在 Quicksight 的“企业版”中提供
You can further choose the computation type you want to perform and add that insight to your analysis. “Forecast” and Anomaly detection are powered by machine learning and are available in “Enterprise edition” of Quicksight

AWS Quicksight - Creating Story
故事是一个选项,您可以在其中捕获一系列屏幕并逐个播放。例如,如果您想使用不同的筛选器选项查看可视化内容,则可以使用故事。要创建故事,请单击最左侧面板上的“故事”。默认情况下,有一个名为“故事板 1”的故事。现在使用最右侧顶部面板上的捕获图标捕获屏幕。屏幕的每个捕获也被称为场景。您可以捕获多个场景,它们将被添加到“故事板 1”下。一旦您的主要数据源刷新,故事中的数据将自动刷新。
Story is an option wherein you capture a series of screens and play them one by one. For example, if you want to see a visual with different filter options, you can use story. To create a Story, click on Story on the leftmost panel. By default, there is a story with name Storyboard 1. Now capture the screen using the capture icon at the right most panel on the top. Each capture of the screen is also referred to as Scene. You can capture multiple scenes and those will get added under “Storyboard 1”. The data in the story gets automatically refreshed once your main data source is refreshed.

AWS Quicksight - Using Parameters
参数是为传递给用户的控制而创建的变量,用于修改仪表板。可以使用输入数据集的字段或为分析创建的筛选器创建参数。例如,您使用筛选器创建了一个参数,仪表板用户可以直接应用筛选器,而无需创建任何筛选器。
Parameters are variables that are created to pass control of the user to modify the dashboards. Parameters can be created using the fields of the input data set or on the filters created for analysis. For example, you create a parameter using a filter, the dashboard users can directly apply filter without creating any filter.

Creating a Parameter
在本节中,我们将看到如何创建参数:
In this section, we will see how to create a parameter −
Step 1 - 输入参数的名称。让我们采用性别作为参数。
Step 1 − Enter the name of parameter. Let us take Gender as parameter.
Step 2 - 选择数据类型。默认情况下,它是字符串。
Step 2 − Choose data type. By default, it is string.
Step 3 - 选择如下所示的可能选项。
Step 3 − Choose the possible options as below.

将添加该参数。你可以选择将控件添加到仪表板。
The parameter would be added. You can choose to add control to the dashboard.
AWS Quicksight - Sharing Analysis
分析准备就绪后,可以通过电子邮件或其他 Quicksight 用户与用户分享。在右上角菜单中,有一个 “Share” 图标
Once the analysis is ready, this can be shared with users by email or other Quicksight users. On the top right side menu, there is a “Share” icon

默认情况下,只有作者或管理员才能访问该分析。您需要向用户提供访问权限才能查看分析。单击“管理分析访问权限”后,它将显示所有注册用户。您可以选择要向其扩展访问权限的用户,然后单击“邀请用户”。用户将收到一封电子邮件通知,一旦他们接受了通知,他们将可以通过电子邮件获取分析。
By default, the analysis can be accessed by the author or admin only. You would require providing access to the user to be able to view the analysis. On clicking “Manage analysis access”, it will show all the registered users. You can choose the users you want to extend the access and click on “Invite users”. The users will get an email notification and once they accept the notification, they will be able to get analysis by email.

AWS Quicksight - Dashboards
仪表板显示分析的屏幕截图。与分析不同,仪表板只能作为屏幕截图进行读取。人们可以仅仅使用视觉元素中创建的参数和筛选器来创建新的视觉元素,但图表相同
A dashboard shows the screenshot of the analysis. Unlike Analysis, dashboards are read as only screenshots. One can just use the parameters and filters created in visuals to create new visuals but with same charts

若要生成已经创建的分析的仪表板,只需在共享图标下单击“发布仪表板”。为仪表板提供任意名称,然后单击“发布仪表板”图标。
To generate a dashboard of the analysis you have created, just click on publish dashboard under share icon. Provide any name to the dashboard and click on “Publish Dashboard” icon.
可以选择与该帐户中的所有用户共享仪表板,或者仅与特定用户共享。
You can opt to share the dashboard with all users in this account or only particular users.

现在可以在主页屏幕上的 “All dashboards” 选项卡下看到仪表板。
Now the dashboard is visible under “All dashboards” tab on home screen.

以下是附加了筛选器的仪表板样本。你可以看到,除了应用创建视觉元素时添加的筛选器外,没有其他编辑仪表板的选项。
Here is the sample dashboard with a filter attached to it. You can see that there is no option to edit the dashboard except applying filters added while creating visuals.

AWS Quicksight - Managing Quicksight
管理 Quicksight 是为了管理你当前的账户。你可以为用户添加具有相应角色、管理你的订阅,并检查 SPICE 容量或白名单域用于嵌入。你将需要管理员访问权限才能执行此页面上的任何活动。
Manage Quicksight is to manage your current account. You can add users with respective roles, manage your subscription, and check SPICE capacity or whitelist domains for embedding. You would require admin access to perform any activity on this page.
在用户个人资料下,你会发现管理 Quicksight 的选项。
Under the user profile, you will find the option to manage Quicksight.

点击管理订阅后,将出现以下屏幕。它将显示此账户中的用户及其各自的角色。
On clicking Manage subscription, below screen will appear. It will show the users in this account and their respective roles.

你还有一个搜索选项;以防你特别想搜索 Quicksight 中的现有用户。
You also have a search option; in case you want to particularly search for an existing user in Quicksight.
你可以邀请具有有效电子邮件地址的用户,或者你可以使用有效的 IAM 账户添加用户。使用 IAM 角色的用户随后可以登录到他们的 Quicksight 账户,并查看他们可以访问的仪表板。
You can invite users with valid email address or you can add users with a valid IAM account. The users with IAM role can then login to their Quicksight account and view the dashboard to which they have access.

你的订阅将显示你订阅的 Quicksight 版本。
Your Subscriptions will show the edition of Quicksight you are subscribed to.

SPICE 容量显示了其计算引擎的使用容量以及到目前为止使用的容量。如果需要,可以选择购买更多容量。
SPICE capacity shows the capacity of their calculation engine being opted for and the amount used so far. There is an option of purchasing more capacity if required.

账户设置显示 Quicksight 账户的详细信息 - 通知电子邮件地址、AWS 资源到 Quicksight 的权限,或者你还可以选择关闭账户。
Account settings shows details of Quicksight account − notification email address, AWS resource permissions to Quicksight, or you also have an option to close the account.

当你关闭 Quicksight 账户时,它会删除与以下对象相关的所有数据 -
When you close Quicksight account, it deletes all the data related to below objects −
-
Data Sources
-
Data Sets
-
Analyses
-
Published Dashboards
管理 VPC 连接允许你管理和添加 VPC 连接到 Quicksight。要添加一个新的 VPC 连接,你需要提供以下详细信息 -
Manage VPC connection allows you to manage and add VPC connection to Quicksight. To add a new VPC connection, you need to provide the following details −


域和嵌入允许你白名单化你希望为用户嵌入 Quicksight 仪表板的域。它只支持在 Quicksight 中白名单化的 https:// 域 -
Domains and embedding allows you to whitelist the domain on which you want to embed Quicksight dashboards for the users. It only supports https:// domain to whitelist in Quicksight −
如果你想使用,你还可以选择下面的复选框来包含任何子域。当你点击添加按钮时,它会将域添加到 Quicksight 中允许嵌入的域名的列表中。
You can also include any subdomains if you want to use by selecting the checkbox shown below. When you click on Add button, it adds the domain to the list of domain names allowed in Quicksight for embedding.

要编辑允许的域,你需要点击域名旁边的编辑按钮。你可以进行更改,并点击更新。
To edit an allowed domain, you need to click on Edit button located beside the domain name. You can make changes and click on Update.

AWS Quicksight - Edition Type
AWS Quicksight 支持不同的版本,它们根据用户管理、权限和支持的功能而有所不同 - Standard 和 Enterprise 。这两个版本都支持 Quicksight 创建和共享数据可视化的所有功能。
AWS Quicksight supports different editions which vary as per user management, permissions and features supported − Standard and Enterprise. Both of these editions support all the Quicksight features for creating and sharing data visualizations.
企业版提供了对 AWS 目录的 Active Directory 集成的支持。企业版中还支持多种其他功能,如下所示 -
Enterprise edition offers support for Active Directory integration to AWS directory. There are various other features which are supported in Enterprise edition as given below −
Features Supported |
Standard Edition |
Enterprise Edition |
# of Free Authors |
1 |
1 |
# of Free Trial Authors (60Days) |
4 |
4 |
Included SPICE Capacity |
10 GB/User |
10 GB/User |
Readers |
N/A |
$0.30/session |
Additional SPICE Capacity |
$0.25/GB/mo. |
$0.38/GB/mo. |
Connect to spreadsheets, databases, data lakes, and business apps |
✓ |
✓ |
Easily analyze data with AutoGraph |
✓ |
✓ |
Fast, scalable visualizations |
✓ |
✓ |
Publish dashboards for interactive data access |
✓ |
✓ |
Single-Sign-On with SAML or OpenID Connect |
✓ |
✓ |
Web and mobile access |
✓ |
✓ |
Drill-down to detail and customize filters |
✓ |
✓ |
Enable audit logs with AWS CloudTrail |
✓ |
✓ |
Reader Role |
✓ |
|
Securely Access data in Private VPCs and On-Prem |
✓ |
|
Row Level Security |
✓ |
|
Hourly refresh of SPICE data |
✓ |
|
Secure data encryption at rest |
✓ |
|
Connect to Active Directory |
✓ |
|
Use Active Directory groups |
✓ |
您可以在 Manage Quicksight 选项中选中 AWS Quicksight 的订阅类型。
You can check the subscription type of AWS Quicksight with Manage Quicksight option.

在企业版中,AWS Quicksight 允许您使用以下任何方式来管理用户 −
In Enterprise edition, AWS Quicksight allows you to manage users using any of the below ways −
-
Using Microsoft Active Directory: In Enterprise edition, you can add/remove Microsoft Active Directory groups to create and deactivate user accounts. You can access the directory groups directly or by using the AD Connector.
-
Federated logins.
-
Inviting users by email.
要在 Quicksight 中管理 AD 用户/群组,您必须导航到 Manage Quicksight → Manage users/Manage groups
To manage your AD users/groups in Quicksight, you have to navigate to Manage Quicksight → Manage users/Manage groups
您还可以单击下拉列表来更改现有用户的角色 −
You can also change the role of an existing user by clicking on drop down list −
-
Admin
-
Author
-
Reader
AWS Quicksight 管理员还可以使用管理用户选项来重置现有用户的密码,如下所示 −
An AWS Quicksight administrator can also reset the password of an existing user using Manage User option as shown below −

您可以使用管理帐户选项从 AQS Quicksight 标准版更新到企业版。要执行升级,用户应拥有 AWS Quicksight 管理员权限。
You can update from AQS Quicksight Standard edition to Enterprise edition using Manage account option. To perform an upgrade, the user should have AWS Quicksight administrator privilege.
单击右上角的个人资料图标 → 立即升级。
Click on your profile icon at top right corner → Upgrade now.

单击升级后,将出现以下屏幕。要完成升级,请单击升级按钮。
Once you click on Upgrade, following screen appears. To complete the upgrade, click on the Upgrade button.

Note − 一旦您将订阅从标准版更改为企业版,则无法回滚。
Note − Once you change your subscription from Standard edition to Enterprise edition, you cannot roll it back.
AWS Quicksight - Managing IAM Policies
要管理 Quicksight 账户的 IAM 策略,您可以使用 root 用户或 IAM 凭证。建议使用 IAM 凭证而不是 root 用户来管理资源访问和策略。
To manage IAM policies for Quicksight account, you can use root user or IAM credentials. It is recommended to use IAM credentials to manage resource access and policies instead of root user.
注册并使用 Amazon Quicksight 需要以下策略:
Following policies are required to signup and use Amazon Quicksight −
Standard Edition
-
ds:AuthorizeApplication
-
ds:CheckAlias
-
ds:CreateAlias
-
ds:CreateIdentityPoolDirectory
-
ds:DeleteDirectory
-
ds:DescribeDirectories
-
ds:DescribeTrusts
-
ds:UnauthorizeApplication
-
iam:CreatePolicy
-
iam:CreateRole
-
iam:ListAccountAliases
-
quicksight:CreateUser
-
quicksight:CreateAdmin
-
quicksight:Subscribe
Enterprise Edition
除了上述策略外,企业版还需要以下权限:
Apart from the above mentioned policies, below permissions are required in enterprise edition −
-
quicksight:GetGroupMapping
-
quicksight:SearchDirectoryGroups
-
quicksight:SetGroupMapping
您还可以允许 user to manage permissions for AWS resources in Quicksight 。以下 IAM 策略应该在这两个版本中分配:
You can also allow a user to manage permissions for AWS resources in Quicksight. Following IAM policies should be assigned in both editions −
-
iam:AttachRolePolicy
-
iam:CreatePolicy
-
iam:CreatePolicyVersion
-
iam:CreateRole
-
iam:DeletePolicyVersion
-
iam:DeleteRole
-
iam:DetachRolePolicy
-
iam:GetPolicy
-
iam:GetPolicyVersion
-
iam:GetRole
-
iam:ListAttachedRolePolicies
-
iam:ListEntitiesForPolicy
-
iam:ListPolicyVersions
-
iam:ListRoles
-
s3:ListAllMyBuckets
要防止 AWS 管理员取消订阅 Quicksight,您可以拒绝所有用户 “quicksight:Unsubscribe”
To prevent an AWS administrator to unsubscribe from Quicksight, you can deny all users “quicksight:Unsubscribe”
IAM policy for dashboard embedding
要在网页中嵌入 AWS Quciksight 仪表板 URL,您需要将以下 IAM 策略分配给用户:
To embed an AWS Quciksight dashboard URL in web page, you need the following IAM policies to be assigned to the user −
{
"Version": "2012-10-17",
"Statement": [
{
"Action": "quicksight:RegisterUser",
"Resource": "*",
"Effect": "Allow"
},
{
"Action": "quicksight:GetDashboardEmbedUrl",
"Resource": "arn:aws:quicksight:us-east-1:
868211930999:dashboard/
f2cb6cf2-477c-45f9-a1b3-639239eb95d8 ",
"Effect": "Allow"
}
]
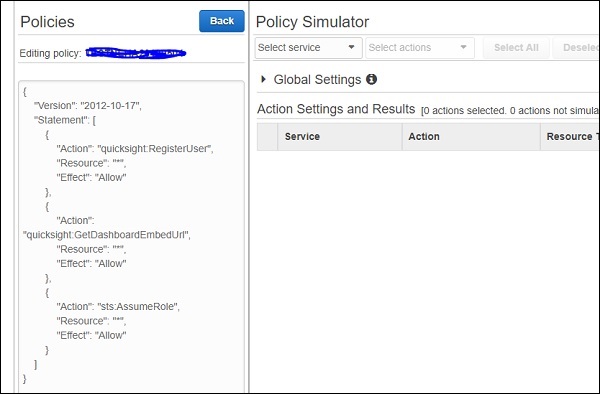
}您可以在 Quicksight 中使用 IAM 策略模拟器管理和测试这些角色和策略。以下是访问 IAM 策略模拟器的链接:
You can manage and test these roles and policies using IAM policy simulator in Quicksight. Below is the link to access IAM Policy simulator −
链接:https://policysim.aws.amazon.com/home/index.jsp? [https://policysim.aws.amazon.com/home/index.jsp? ]

AWS Quicksight - Embedding Dashboard
您还可以将 Quicksight 仪表板嵌入到外部应用程序/网页中,或使用 AWS Cognito 服务来控制用户访问。要执行用户控制,您可以在 Cognito 中创建用户池和身份池,并将嵌入仪表板策略分配给身份池。
You can also embed your Quicksight dashboards into external applications/web pages or can control user access using AWS Cognito service. To perform user control, you can create user pool and identity pool in Cognito and assign Embed dashboard policies to identity pool.
AWS Cognito 是一项 IAM 服务,允许管理员创建和管理临时用户以提供对应用程序的访问权限。通过使用身份池,您可以管理这些用户池上的权限。
AWS Cognito is an IAM service which allows administrators to create and manage temporary users to provide access to applications. With the use of identity pool, you can manage permissions on these user pools.
让我们看看如何生成安全的仪表板 URL 并执行用户控件 −
Let us see how we can generate secure dashboard URL and perform user control −
Step 1 - Creating user pools and users
在 AWS Cognito 中创建用户池并创建用户。转到 Amazon Cognito → Manage User Pools → Create a User Pool 。
Create user pool in AWS Cognito and create users. Go to Amazon Cognito → Manage User Pools → Create a User Pool.
Step 2 - Creating an identity pool
当用户池创建完成后,下一步是创建一个身份池。转到 https://console.aws.amazon.com/cognito/home?region=us-east-1
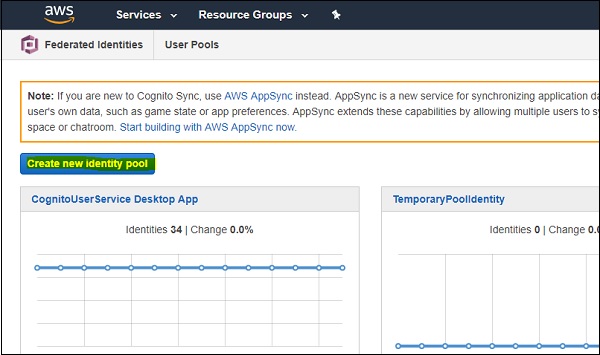
When user pool is created, next step is to create an identity pool. Go to https://console.aws.amazon.com/cognito/home?region=us-east-1
单击“创建新身份池”。
Click on “Create New Identity Pool”.
输入身份池的相应名称。转到身份验证提供程序部分并选择“Cognito”选项。
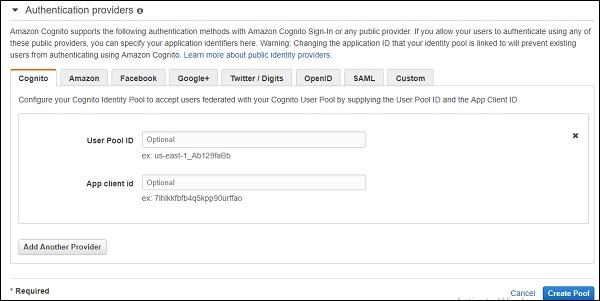
Enter the appropriate name of an identity pool. Go to the Authentication Providers section and select “Cognito” option.
Step 3 - Creating Cognito roles
输入用户池 ID(您的用户池 ID)和应用程序客户端 ID(转到用户池中的应用程序客户端并复制 ID)。
Enter the User Pool ID (your User pool ID) and App Client ID (go to App Clients in user pool and copy id).
接下来是单击“创建池”并单击“允许”以在 IAM 中创建身份池的角色。它将创建 2 个 Cognito 角色。
Next is to click on ‘Create Pool’ and click on ‘Allow’ to create roles of the identity pool in IAM. It will create 2 Cognito roles.
Step 4 - Assigning Custom Policy
下一步是在上述步骤中为创建的身份角色分配自定义策略 −
Next step is to assign custom policy to identity roles created in the above step −
{
   "Version": "2012-10-17",
   "Statement": [
      {
         "Action": "quicksight:RegisterUser",
         "Resource": "*",
         "Effect": "Allow"
      },
      {
         "Action": "quicksight:GetDashboardEmbedUrl",
         "Resource": "*",
         "Effect": "Allow"
      },
      {
         "Action": "sts:AssumeRole",
         "Resource": "*",
         "Effect": "Allow"
      }
   ]
}
您可以将仪表板 Amazon 资源名称 (ARN) 传递给 quicksight:GetDashboardEmbedUrl”,而不是 “*” 以限制用户仅访问一个仪表板。
You can pass dashboard Amazon Resource Name (ARN) under quicksight:GetDashboardEmbedUrl” instead of “*” to restrict user to access only one dashboard.
Step 5 - Logging into Cognito application
下一步是使用用户池中的用户凭证登录到 Cognito 应用程序。当用户登录应用程序时,Cognito 会生成 3 个令牌 −
Next step is to login to Cognito application with user credentials in user pool. When user logins into application, Cognito generates 3 tokens −
-
IDToken
-
AccessToken
-
Refresh Token
要创建临时 IAM 用户,凭证如下所示 −
To create a temporary IAM user, credentials are as shown below −
AWS.config.region = 'us-east-1';
AWS.config.credentials = new AWS.CognitoIdentityCredentials({
   IdentityPoolId:"Identity pool ID", Logins: {
      'cognito-idp.us-east-1.amazonaws.com/UserPoolID': AccessToken
   }
});
要生成临时 IAM 凭证,您需要使用以下参数调用 sts.assume 角色方法 −
For generating temporary IAM credentials, you need to call sts.assume role method with the below parameters −
var params = {
   RoleArn: "Cognito Identity role arn", RoleSessionName: "Session name"
};
sts.assumeRole(params, function (err, data) {
   if (err) console.log( err, err.stack);
   // an error occurred
   else {
      console.log(data);
   })
}
Step 6 - Registering the user in Quicksight
下一步是使用通过以下参数生成的凭证通过 “quicksight.registerUser” 将用户注册到 Quicksight 中 −
Next step is to register the user in Quicksight using “quicksight.registerUser” for credentials generated in step 3 with the below parameters −
var params = {
   AwsAccountId: “account id”,
   Email: 'email',
   IdentityType: 'IAM' ,
   Namespace: 'default',
   UserRole: ADMIN | AUTHOR | READER | RESTRICTED_AUTHOR | RESTRICTED_READER,
   IamArn: 'Cognito Identity role arn',
   SessionName: 'session name given in the assume role creation',
};
quicksight.registerUser(params, function (err, data1) {
   if (err) console.log("err register user”);
   // an error occurred
   else {
      // console.log("Register User1”);
   }
})
Step 7 - Updating AWS Configuration file
接下来是更新步骤 5 中生成的用户在 AWS 中的配置。
Next is to update AWS configuration for user generated in step 5.
AWS.config.update({
   accessKeyId: AccessToken,
   secretAccessKey: SecretAccessKey ,
   sessionToken: SessionToken,
   "region": Region
});
Step 8 - Generating embed URL for Quicksight dashboard
使用步骤 5 中创建的凭证,调用带有以下参数的 quicksight.getDashboardEmbedUrl 来生成 URL。
With credentials created in step 5, call the quicksight.getDashboardEmbedUrl with the below parameters to generate URL.
var params = {
   AwsAccountId: "Enter AWS account ID",
   DashboardId: "Enter dashboard Id",
   IdentityType: "IAM",
   ResetDisabled: true,
   SessionLifetimeInMinutes: between 15 to 600 minutes,
   UndoRedoDisabled: True | False
}
quicksight.getDashboardEmbedUrl(params,function (err, data) {
   if (!err) {
      console.log(data);
   } else {
      console.log(err);
   }
});
您必须使用上述生成的 URL 从您的应用程序调用 “QuickSightEmbedding.embedDashboard”。
You have to call “QuickSightEmbedding.embedDashboard” from your application using the above generated URL.
与 Amazon Quicksight 一样,嵌入式仪表板还支持以下功能 −
Like Amazon Quicksight, embedded dashboard also supports the following features −
-
Drill-down option
-
Custom actions (link to a new tab)
-
On-screen filters
-
Download to CSV
-
Sorting on visuals
-
Email report opt-in
-
Reset dashboard to defaults option
-
Undo/redo actions on the dashboard
AWS Quicksight - AWS SDKs
您可以使用 AWS Quicksight SDK 来管理以下内容−
You can use AWS Quicksight SDK’s to manage the following −
-
User and group management
-
Embedding dashboards
以下是用于显示嵌入式仪表板的示例 HTML 代码−
Following shows a sample HTML code to be used to display an embedded dashboard −
<!DOCTYPE html>
<html>
   <head>
      <title>Sample Embed</title>
      <script type="text/javascript" src="https://unpkg.com/amazon-quicksight-embedding-sdk@1.0.1/dist/quicksight-embedding-js-sdk.min.js"></script>
      <script type="text/javascript">
         function embedDashboard() {
            var containerDiv = document.getElementById("dashboardContainer");
            var params = {
               url: "https://us-east-1.quicksight.aws.amazon.com/sn/dashboards/xxx-x-x-xx-x-x-x-x-x-x-x-xx-xx-x-xx",
               container: containerDiv,
               parameters: {
                  country: 'United States'
               },
               height: "600px",
               width: "800px"
            };
            var dashboard = QuickSightEmbedding.embedDashboard(params);
            dashboard.on('error', function() {});
            dashboard.on('load', function() {});
            dashboard.setParameters({country: 'Canada'});
         }
      </script>
   </head>
<html>
要使用 AWS SDK,您应该熟悉以下内容−
To use AWS SDK’s, you should be familiar with the following −
-
JSON
-
Web services
-
HTTP requests
-
One or more programming languages, such as JavaScript, Java, Python, or C#.
AWS Quicksight - Developer Responsibilities
AWS Quicksight 开发人员执行以下工作职责 -
Following job responsibilities are performed by an AWS Quicksight developer −
-
Person should have relevant work experience in analytics, reporting and business intelligence tools.
-
Understanding customer requirements and design solution in AWS to setup ETL and Business Intelligence environment.
-
Understanding different AWS services, their use and configuration.
-
Proficient in using SQL, ETL, Data Warehouse solutions and databases in a business environment with large-scale, disparate datasets.
-
Complex quantitative and data analysis skills.
-
Understanding AWS IAM policies, roles and administrator of AWS services.