Bokeh 简明教程
Bokeh - Layouts
Bokeh 可视化可以适当地布置在不同的布局选项中。这些布局以及大小调整模式会导致根据浏览器窗口的大小自动调整大小。为了保持一致的外观,布局中的所有元素必须具有相同的大小调整模式。小部件(按钮、菜单等)保存在一个单独的小部件框中,而不在绘制图形中。
Bokeh visualizations can be suitably arranged in different layout options. These layouts as well as sizing modes result in plots and widgets resizing automatically as per the size of browser window. For consistent appearance, all items in a layout must have same sizing mode. The widgets (buttons, menus, etc.) are kept in a separate widget box and not in plot figure.
第一种布局是 Column 布局,它垂直显示绘制图形。 column() function 在 bokeh.layouts 模块中定义,并采用以下特征签名 −
First type of layout is Column layout which displays plot figures vertically. The column() function is defined in bokeh.layouts module and takes following signature −
from bokeh.layouts import column
col = column(children, sizing_mode)
children – 绘制图形和/或小部件的列表。
children − List of plots and/or widgets.
sizing_mode – 确定布局中元素的大小调整方式。可能的值为“fixed”(固定)、“stretch_both”(双向拉伸)、“scale_width”(按宽度缩放)、“scale_height”(按高度缩放)、“scale_both”(双向缩放)。默认值为“fixed”(固定)。
sizing_mode − determines how items in the layout resize. Possible values are "fixed", "stretch_both", "scale_width", "scale_height", "scale_both". Default is “fixed”.
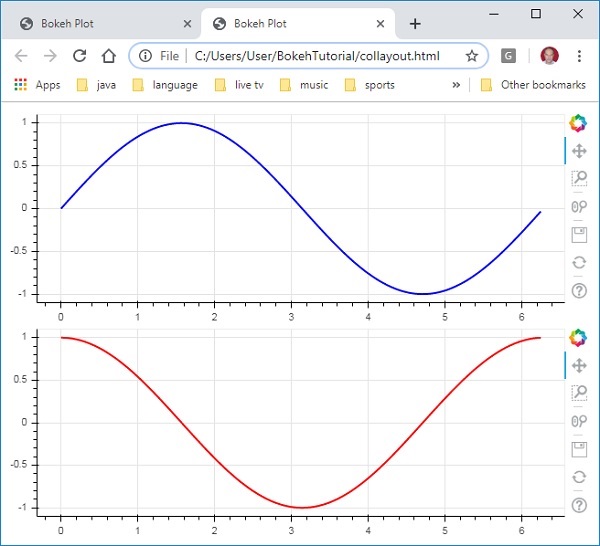
以下代码生成两个 Bokeh 图形,并将它们放置在 column 布局中,以便它们垂直显示。每个图形中显示表示 x 和 y 数据序列中正弦和余弦关系的线形符号。
Following code produces two Bokeh figures and places them in a column layout so that they are displayed vertically. Line glyphs representing sine and cos relationship between x and y data series is displayed in Each figure.
from bokeh.plotting import figure, output_file, show
from bokeh.layouts import column
import numpy as np
import math
x = np.arange(0, math.pi*2, 0.05)
y1 = np.sin(x)
y2 = np.cos(x)
fig1 = figure(plot_width = 200, plot_height = 200)
fig1.line(x, y1,line_width = 2, line_color = 'blue')
fig2 = figure(plot_width = 200, plot_height = 200)
fig2.line(x, y2,line_width = 2, line_color = 'red')
c = column(children = [fig1, fig2], sizing_mode = 'stretch_both')
show(c)
Output
类似地,Row 布局横向排列绘制图形,它使用 bokeh.layouts 模块中定义的 row() function 。正如您所想,它也采用两个参数(类似于 column() function )——children 和 sizing_mode。
Similarly, Row layout arranges plots horizontally, for which row() function as defined in bokeh.layouts module is used. As you would think, it also takes two arguments (similar to column() function) – children and sizing_mode.
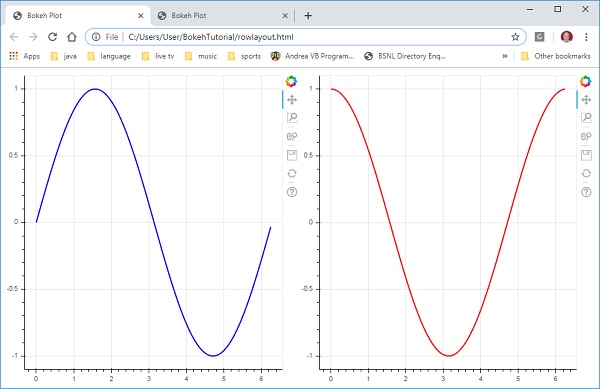
上图中垂直显示的正弦和余弦曲线现在通过以下代码以 row 布局水平显示
The sine and cos curves as shown vertically in above diagram are now displayed horizontally in row layout with following code
from bokeh.plotting import figure, output_file, show
from bokeh.layouts import row
import numpy as np
import math
x = np.arange(0, math.pi*2, 0.05)
y1 = np.sin(x)
y2 = np.cos(x)
fig1 = figure(plot_width = 200, plot_height = 200)
fig1.line(x, y1,line_width = 2, line_color = 'blue')
fig2 = figure(plot_width = 200, plot_height = 200)
fig2.line(x, y2,line_width = 2, line_color = 'red')
r = row(children = [fig1, fig2], sizing_mode = 'stretch_both')
show(r)
Output
Bokeh 包还具有网格布局。它在一个由行和列组成的二维网格中容纳多个绘制图形(以及小部件)。bokeh.layouts 模块中的 gridplot() function 返回一个网格和一个可以通过 toolbar_location 属性进行定位的单一统一工具栏。
The Bokeh package also has grid layout. It holds multiple plot figures (as well as widgets) in a two dimensional grid of rows and columns. The gridplot() function in bokeh.layouts module returns a grid and a single unified toolbar which may be positioned with the help of toolbar_location property.
这与 row 或 column 布局不同,其中每个绘制图形都显示自己的工具栏。grid() 函数也使用 children 和 sizing_mode 参数,其中 children 是列表的列表。请确保每个子列表的维度相同。
This is unlike row or column layout where each plot shows its own toolbar. The grid() function too uses children and sizing_mode parameters where children is a list of lists. Ensure that each sublist is of same dimensions.
在以下代码中,在两行两列的网格中绘制了 x 和 y 数据序列之间四个不同的关系。
In the following code, four different relationships between x and y data series are plotted in a grid of two rows and two columns.
from bokeh.plotting import figure, output_file, show
from bokeh.layouts import gridplot
import math
x = list(range(1,11))

y1 = x
y2 =[11-i for i in x]
y3 = [i*i for i in x]
y4 = [math.log10(i) for i in x]

fig1 = figure(plot_width = 200, plot_height = 200)
fig1.line(x, y1,line_width = 2, line_color = 'blue')
fig2 = figure(plot_width = 200, plot_height = 200)
fig2.circle(x, y2,size = 10, color = 'green')
fig3 = figure(plot_width = 200, plot_height = 200)
fig3.circle(x,y3, size = 10, color = 'grey')
fig4 = figure(plot_width = 200, plot_height = 200, y_axis_type = 'log')
fig4.line(x,y4, line_width = 2, line_color = 'red')
grid = gridplot(children = [[fig1, fig2], [fig3,fig4]], sizing_mode = 'stretch_both')
show(grid)