Advanced Excel Charts 简明教程
Advanced Excel - Bullet Chart
子弹图的出现是为了克服仪表图的缺点。我们可以将它们称为线性仪表图。子弹图是由斯蒂芬·菲尤引入的。子弹图用于轻松比较类别并节省空间。子弹图的格式是灵活的。
Bullet charts came into existence to overcome the drawbacks of Gauge charts. We can refer to them as Liner Gauge charts. Bullet charts were introduced by Stephen Few. A Bullet chart is used to compare categories easily and saves on space. The format of the Bullet chart is flexible.
What is a Bullet Chart?
根据斯蒂芬·菲尤的说法,子弹图支持将一个度量与一个或多个相关度量(例如,目标或过去某个时间点的相同度量,例如一年前)进行比较,并将度量与声明其质量状态(例如,好、满意和差)的定义定量范围联系起来。其线性设计不仅使其占用的空间小,而且比仪表图更支持高效阅读。
According to Stephen Few, Bullet charts support the comparison of a measure to one or more related measures (for example, a target or the same measure at some point in the past, such as a year ago) and relate the measure to defined quantitative ranges that declare its qualitative state (for example, good, satisfactory and poor). Its linear design not only gives it a small footprint, but also supports more efficient reading than the Gauge charts.
请考虑以下给出的示例 -
Consider an example given below −
在子弹图中,您将看到以下组件 −
In a Bullet chart, you will have the following components −
-
The qualitative bands representing the qualitative states −
Band |
Qualitative Value |
<30% |
Poor |
30% - 60% |
Fair |
60% - 80% |
Good |
> 80% |
Excellent |
-
Target Value, say 80%.
-
Actual Value, say 70%.
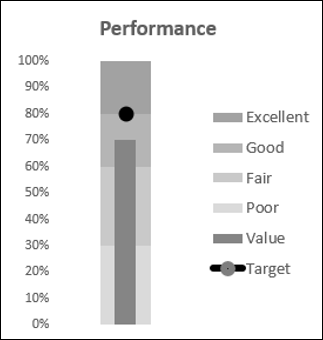
根据以上的值,子弹图如下所示。
With the above values, the Bullet chart looks as shown below.
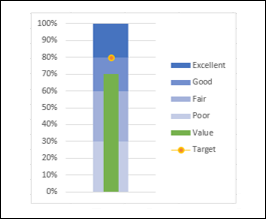
虽然我们在上图中使用了颜色,但 Stephen Few 建议仅使用灰色阴影,以照顾色盲人群。
Though we used colors in the above chart, Stephen Few suggests the usage of only Gray shades in the interest of color-blind people.
Advantages of Bullet Charts
子弹图具有以下用途和优点 −
Bullet charts have the following uses and advantages −
-
Bullet Charts are widely used by data analysts and dashboard vendors.
-
Bullet charts can be used to compare the performance of a metric. For example, if you want to compare the sales of two years or to compare the total sales to a target, you can use bullet charts.
-
You can use Bullet chart to track the number of defects in Low, Medium and High categories.
-
You can visualize the Revenue flow across the Fiscal year.
-
You can visualize the expenses across the Fiscal year.
-
You can track Profit%.
-
You can visualize customer satisfaction and can be used to display KPIs also.
Preparation of Data
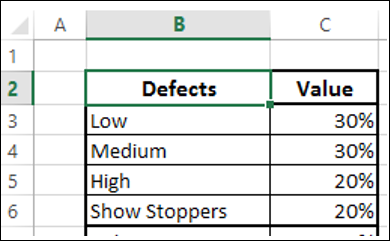
如下所示排列数据。
Arrange the data as given below.
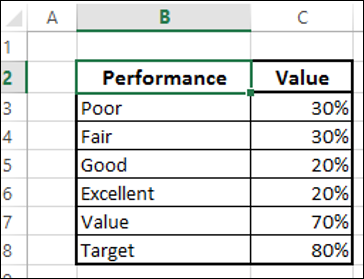
正如您所观察到的,定性值列于“绩效”列中。波段由“值”列表示。
As you can observe, the qualitative values are given in the column – Performance. The Bands are represented by the column – Value.
Creating a Bullet Chart
以下是如何创建子弹图的步骤 −
Following are the steps to create a Bullet chart −
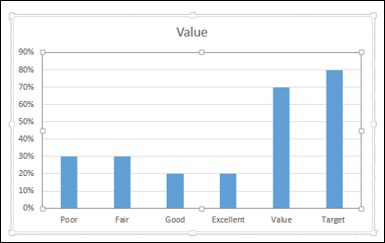
Step 1 − 选择数据并插入一个堆积柱形图。
Step 1 − Select the data and insert a Stacked Column chart.
Step 2 − 单击图表。
Step 2 − Click on the chart.
Step 3 - 单击功能区上的设计选项卡。
Step 3 − Click the DESIGN tab on the Ribbon.
Step 4 − 单击“数据”组中的“切换行/列”按钮。
Step 4 − Click Switch Row/ Column button in the Data group.
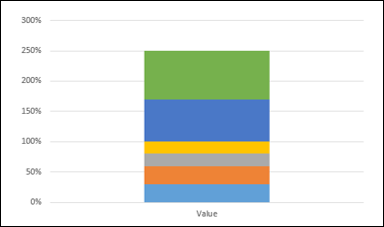
Step 5 − 更改图表类型。
Step 5 − Change the chart type.
-
Click Change Chart Type.
-
Click the Combo icon.
-
Change the chart type for Target to Stacked Line with Markers.
-
Check the box – Secondary Axis for Target and click OK.

Step 6 - 如您所见,主垂直坐标轴和次垂直坐标轴的范围不同。按照下列步骤使其相等。
Step 6 − As you can see, the Primary and the Secondary Vertical Axis have different ranges. Make them equal as follows.
-
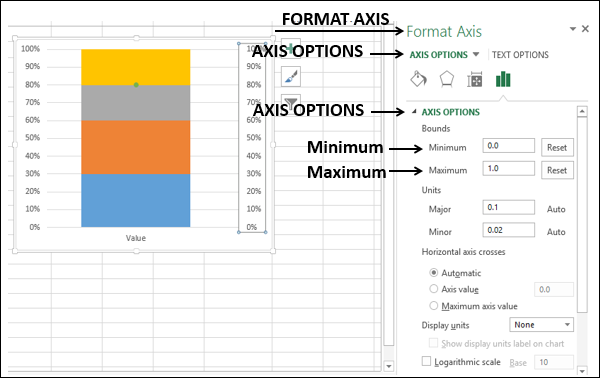
Right click on Primary Vertical Axis and select Format Axis.
-
Click on the AXIS OPTIONS tab in the Format Axis pane.
-
In AXIS OPIONS, under Bounds, type the following − 0.0 for Minimum1.0 for Maximum
-
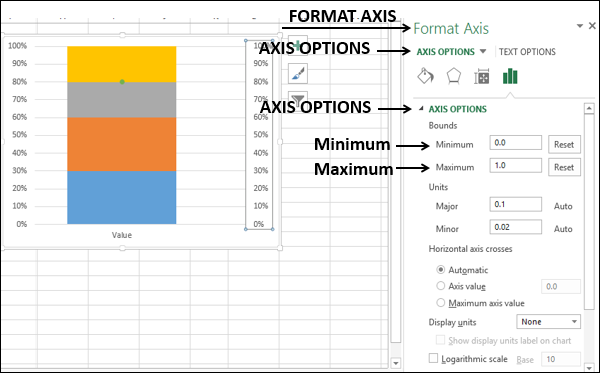
Repeat the above steps for Secondary Vertical Axis.
Step 7 - 取消选择图表元素中的次垂直坐标轴。
Step 7 − Deselect Secondary Vertical Axis in the Chart Elements.
Step 8 - 设计图表
Step 8 − Design the chart
-
Click on the chart.
-
Click the DESIGN tab on the Ribbon.
-
Click Change Chart Type.
-
Check the Secondary Axis box for the Value series.
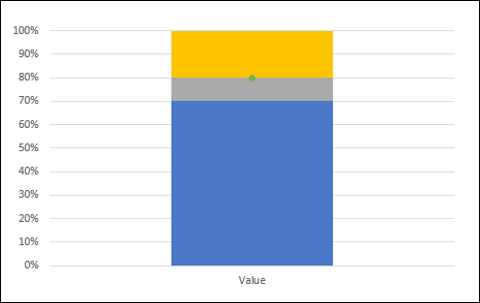
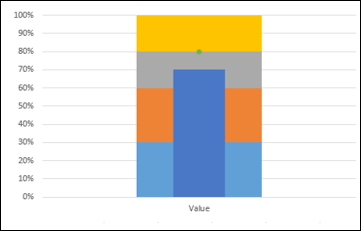
Step 9 - 右键单击“值”的列(上述图表中的蓝色部分)。
Step 9 − Right click on the column for Value (blue color in the above chart).
Step 10 - 选择“设置资料系列格式”。
Step 10 − Select Format Data Series.
Step 11 - 在“设置资料系列格式”窗格中,“系列选项”下,将间隙宽度更改为 500%。
Step 11 − Change Gap Width to 500% under SERIES OPTIONS in Format Data Series pane.
Step 12 - 取消选择图表元素中的次垂直坐标轴。
Step 12 − Deselect Secondary Vertical Axis in the Chart Elements.
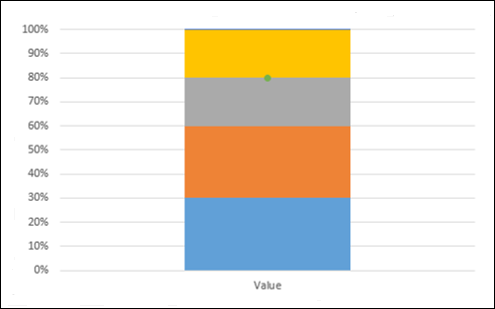
图表将呈现如下所示 -
The chart will look as follows −
Step 13 - 按下列方式设计图表 -
Step 13 − Design the chart as follows −
-
Click on the chart.
-
Click Chart Styles at the right corner of the chart.
-
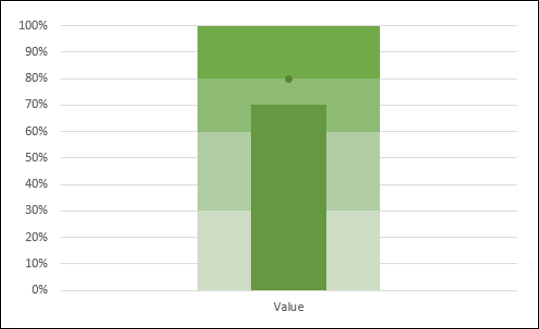
Click the COLOR tab.
-
Select Color 17.
Step 14 - 按照下列方式微调图表。
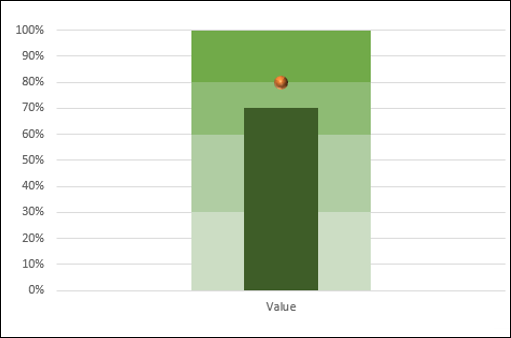
Step 14 − Fine tune the chart as follows.
-
Right click on the Value column.
-
Change the Fill color to dark green.
-
Click on the Target.
-
Change the Fill and Line color of Marker to orange.
-
Increase the size of the Marker.
Step 15 - 优化图表设计。
Step 15 − Fine-tune the chart design.
-
Resize the chart.
-
Select Legend in Chart Elements.
-
Deselect Primary Horizontal Axis in Chart Elements.
-
Deselect Gridlines in Chart Elements.
-
Give a Chart Title.
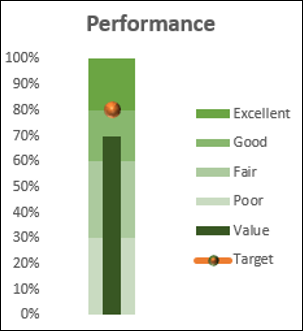
极值图已完成。
Your Bullet chart is ready.
您可以将图表颜色更改为灰色渐变色,使其对色盲人群友好。
You can change the color of the chart to gray gradient scale to make it colorblind friendly.
Bullet Chart in Reverse Contexts
假设要在极值图中显示发现的缺陷数。在这种情况下,缺陷越少意味着质量越高。您可以按以下方式定义缺陷类别 −
Suppose you want to display the number of defects found in a Bullet chart. In this case, lesser defects mean greater quality. You can define defect categories as follows −
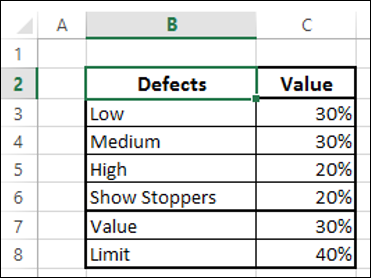
Step 1 - 然后,您可以为缺陷数量定义一个极限,并通过一个值来表示发现的缺陷数量。将值和极限添加到上面的表格。
Step 1 − You can then define a Limit for number of defects and represent the number of defects found by a Value. Add Value and Limit to the above table.
Step 2 - 选择数据。
Step 2 − Select the data.
Step 3 - 如前一节所述创建极值图。
Step 3 − Create a Bullet chart as you have learnt in the previous section.
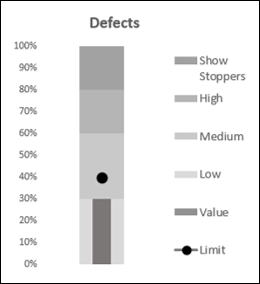
如您所见,为了正确解读上下文,已经更改了范围。
As you can see, the ranges are changed to correctly interpret the context.