Advanced Excel Charts 简明教程
Advanced Excel - Thermometer Chart
温度计图是明确定义的度量实际值的显示,例如任务状态,与目标值相比。这是您将在下一章节学习到的仪表盘图的线性版本。
Thermometer chart is a visualization of the actual value of well-defined measure, for example, task status as compared to a target value. This is a linear version of Gauge chart that you will learn in the next chapter.
您能够通过一个简单的上升温度计图跟踪一段时间针对目标的进展。
You can track your progress against the target over a period of time with a simple rising Thermometer chart.
What is a Thermometer Chart?
温度计图追踪单个任务,例如工作进度,表示与目标相比的当前状态。它显示任务完成百分比,取目标为 100%。
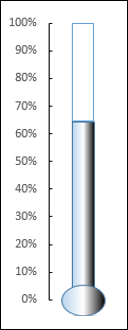
A Thermometer chart keeps track of a single task, for example, completion of work, representing the current status as compared to the target. It displays the percentage of the task completed, taking target as 100%.
温度计图如下所示。
A Thermometer chart looks as shown below.
Advantages of Thermometer Charts
温度计图可用于追踪任何实际值,与目标值相比较完成百分比。它适用于单个值并且是很好的图表,可以纳入到控制台中,以便对达成的百分比、针对目标销售目标的性能百分比、利润百分比、工作完成百分比、预算使用百分比等进行快速视觉影响。
Thermometer chart can be used to track any actual value as compared to the target value as percentage completed. It works with a single value and is an appealing chart that can be included in dashboards for a quick visual impact on % achieved, % performance against the target sales target, % profit, % work completion, % budget utilized, etc.
如果有多个值用于追踪针对目标的实际值,则您可以使用您将在后续章节学习到的子弹图。
If you have multiple values to track the actuals against the targets, you can use Bullet chart that you will learn in a later chapter.
Preparation of Data
以下列方式准备数据:
Prepare the data in the following way −
-
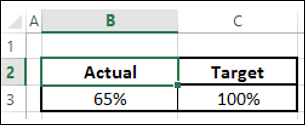
Calculate the Actual as a percentage of the actual value as compared to the target value.
-
Target should always be 100%.
-
Place your data in a table as given below.
Creating a Thermometer Chart
以下是创建温度计图的步骤:
Following are the steps to create a Thermometer chart −
Step 1 − 选择数据。
Step 1 − Select the data.
Step 2 - 插入一个簇状柱形图。
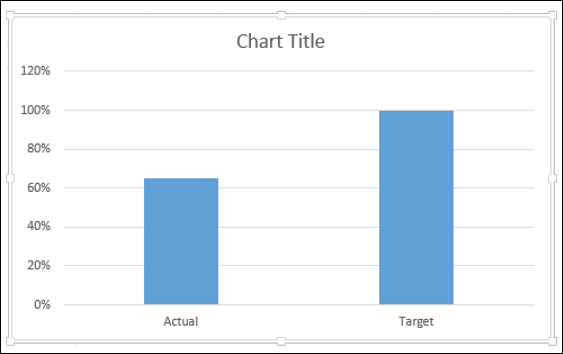
Step 2 − Insert a Clustered Column chart.
正如您所看到的,右侧的柱状图是目标。
As you can see, the right Column is Target.
Step 3 - 在图表中单击一栏。
Step 3 − Click on a Column in the chart.
Step 4 - 单击功能区上的“设计”选项卡。
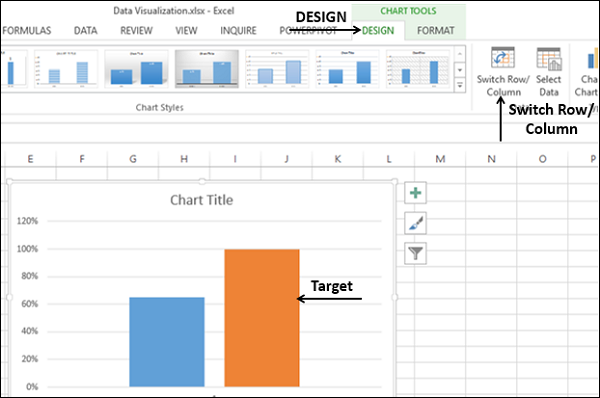
Step 4 − Click the DESIGN tab on the Ribbon.
Step 5 - 单击“切换行/栏”按钮。
Step 5 − Click the Switch Row/ Column button.
Step 6 - 在目标栏上右键单击。
Step 6 − Right click on the Target Column.
Step 7 - 从下拉列表中选择“格式数据系列”。
Step 7 − Select Format Data Series from the dropdown list.
Step 8 - 在“格式数据系列”窗格中的“系列选项”下,单击“次要坐标轴”。
Step 8 − Click on Secondary Axis under SERIES OPTIONS in the Format Data Series pane.
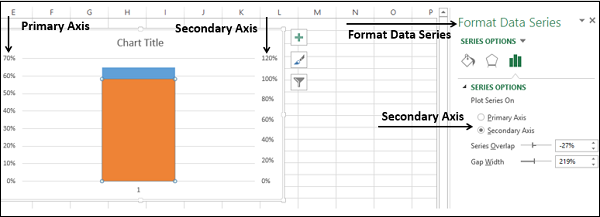
可以看到,主坐标轴和次坐标轴的范围不同。
As you can see, the Primary Axis and the Secondary Axis have different ranges.
Step 9 - 在主坐标轴上右键单击。从下拉列表中选择“格式化坐标轴”。
Step 9 − Right click on the Primary Axis. Select Format Axis from the dropdown list.
Step 10 - 在“格式化坐标轴”窗格中,“坐标轴选项”下的“界限”中,键入以下内容:
Step 10 − Type the following in Bounds under AXIS OPTIONS in the Format Axis pane −
-
0 for Minimum.
-
1 for Maximum.
为次坐标轴重复上述步骤,将“界限”更改为 0 和 1。
Repeat the steps given above for the Secondary Axis to change the Bounds to 0 and 1.
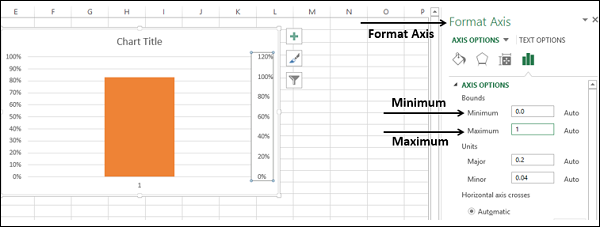
主坐标轴和次坐标轴都将设置为 0% - 100%。
Both the Primary Axis and Secondary Axis will be set to 0% - 100%.
可以看到,目标栏隐藏了实际栏。
As you can observe, the Target Column hides the Actual Column.
Step 11 - 在可见栏(即目标)上右键单击。
Step 11 − Right click on the visible Column, i.e. Target.
Step 12 - 从下拉列表中选择“格式数据系列”。
Step 12 − Select Format Data Series from the dropdown list.
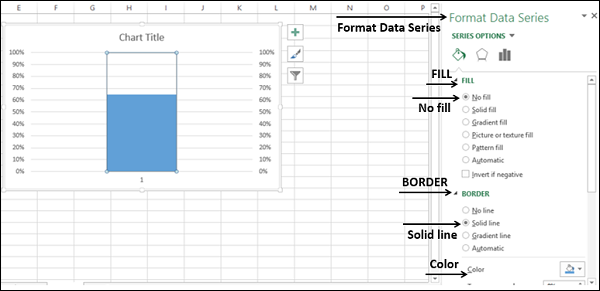
在“格式数据系列”窗格中,选择以下内容:
In the Format Data Series pane, select the following −
-
No fill under the FILL option.
-
Solid line under the BORDER option.
-
Blue under the Color option.
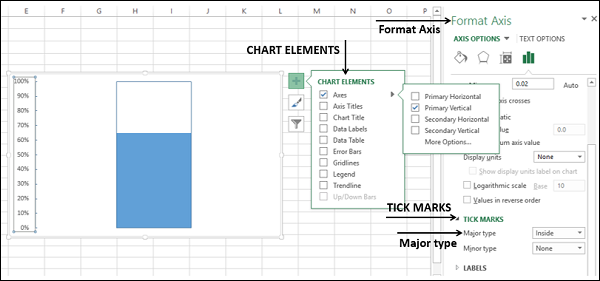
Step 13 - 在“图表元素”中,取消选择以下内容:
Step 13 − In Chart Elements, deselect the following −
-
Axis → Primary Horizontal.
-
Axis → Secondary Vertical.
-
Gridlines.
-
Chart Title.
Step 14 - 右键单击“主垂直轴”。
Step 14 − Right click on the Primary Vertical Axis.
Step 15 - 从下拉列表中选择“设置格式轴”。
Step 15 − Select Format Axis from the dropdown list.
Step 16 - 在“设置格式轴”窗格的“轴选项”下,单击“刻度线”。
Step 16 − Click TICK MARKS under the AXIS OPTIONS in the Format Axis pane.
Step 17 - 为 主要 类型选择 内部 选项。
Step 17 − Select the option Inside for Major type.
Step 18 - 右键单击图表区。
Step 18 − Right click on the Chart Area.
Step 19 - 从下拉列表中选择“设置图表区格式”。
Step 19 − Select Format Plot Area from the dropdown list.
Step 20 - 在“设置图表区格式”窗格中,单击“填充和线条”。选择以下内容:
Step 20 − Click Fill & Line in the Format Plot Area pane. Select the following −
-
No fill under the FILL option.
-
No line under the BORDER option.
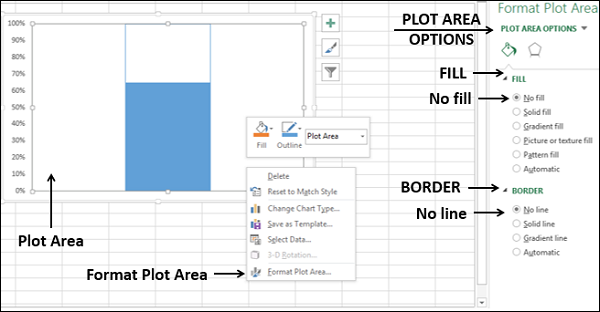
Step 21 - 调整图表区域大小,以获取用于图表体温计形状。
Step 21 − Resize the Chart Area to get the Thermometer shape for the chart.

获得了体温计图表,其中显示实际值与目标值。
You got your Thermometer chart, with the Actual Value as against Target Value being shown.
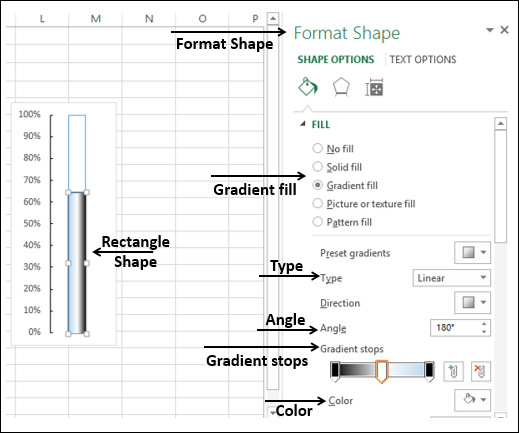
Step 22 - 可以通过一些设置格式来使此体温计图表更具有吸引力。
Step 22 − You can make this Thermometer chart more appealing with some formatting.
-
Insert a Rectangle shape superimposing the blue rectangular part in the chart.
-
In the Format Shape options, select the following − Gradient fill for FILL.Linear for Type.1800 for Angle.
-
Set the Gradient stops at 0%, 50% and 100%.
-
For the Gradient stops at 0% and 100%, choose the color black.
-
For the Gradient stop at 50%, choose the color white.
-
Insert an oval shape at the bottom.
-
Format the oval shape with the same options as of rectangle.
-
The result will be as shown below −

你的美学温度计图表已准备就绪。它在仪表盘上或作为演示文稿的一部分中效果很好。
Your aesthetic Thermometer chart is ready. This will look good on a dashboard or as a part of a presentation.