Excel Data Analysis 简明教程
Exploring Data with Hierarchies
如果您的数据具有更高级别,您能够使用层次结构来轻松浏览和展示数据。对于层次结构中的任何数据值,您能够向下钻取以显示更多详细信息,或向上钻取获得一个全面的视图。
If your data more number of levels, it would be easy for you to explore and present it with Hierarchies. For any data value in your Hierarchy, you can drill down to display more details or drill up to have a holistic view.
如果您的数据模型具有层次结构,您能够在 Power View 中使用它。否则,您能够在 Power View 中使用几个简单的步骤创建层次结构。
If your data model has a hierarchy, you can use it in Power View. Otherwise, you can create a hierarchy in the Power View itself with few easy steps.
Creating a Hierarchy in Power View
在 Power View 中,最好在矩阵可视化中描绘层次结构。按照如下方式在矩阵可视化中创建层次结构 −
In Power View a Hierarchy is best depicted in Matrix visualization. Create a Hierarchy in Matrix visualization as follows −
-
Drag the fields NOC_CountryRegion, Sport, Discipline, Year and Medal – in that order to ROWS area.
-
Drag the field Medal Count to ∑ VALUES. The order of the fields in the ROWS area defines the Hierarchy in Power View.
-
If you are not sure about the order of fields, start with any order and then rearrange them in the ROWS area by dragging them up and down, while looking at the display in the Power View.
你将获得显示以下五个层次结构级别的矩阵可视化效果 −
You will get the following Matrix visualization showing the five Hierarchy levels −
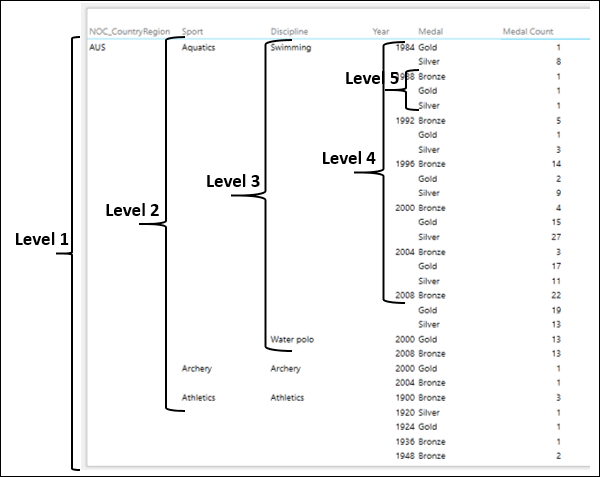
如你所观察,这些层次是嵌套的。
As you observe, the levels are nested.
Drilling Up and Drilling Down the Hierarchy
你可以钻取层次结构,以便一次只显示一个级别。你可以钻取详细信息和生成摘要。
You can drill up and drill down the hierarchy such that you can show just one level at a time. You can drill down for details and drill up for summary.
要启用钻取功能,首先按照以下方式设置显示级别选项 −
To enable drill up and drill down, first set up show levels option as follows −
-
Click the DESIGN tab on the Ribbon.
-
Click Show Levels in the Options group.
-
Select Rows – Enable Drill Down One Level at a Time from the drop-down list.
矩阵会折叠,仅显示 1 级数据。
The Matrix collapses to display only Level 1 data.
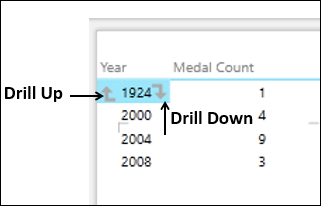
如你所观察,当你单击各个数据项时,该项右侧会显示一个向下箭头,表示钻取。
As you observe, when you click on each of the data items, a downward arrow appears on the right side for that item indicating drill down.
现在,你可以按以下方式一次钻取一层数据 −
Now, you can drill down the data one level at a time as follows −
-
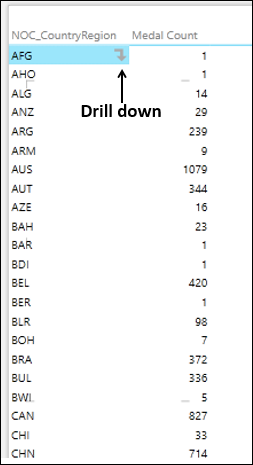
Click Level 1 data item for which you want further details. For example, click AUS. As you observe, Medal Count for AUS is 1079.
-
Click on the arrow to the right side of it. Alternatively, you can double click on the data item.
-
Level 2 data pertaining to AUS will be displayed.
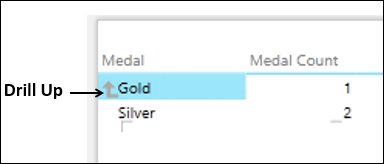
如你所观察,第一个项的左侧会出现一个向上箭头,表示向上钻取,当你单击各个数据项时,该项右侧会显示一个向下箭头,表示向下钻取。
As you observe, an upward arrow appears on the left side of the first item, indicating drill up and when you click on each of the data items, a downward arrow appears on the right side for that item indicating drill down.
现在,你可以按以下方式再向下钻取一层数据 −
Now, you can drill down the data one more level as follows −
-
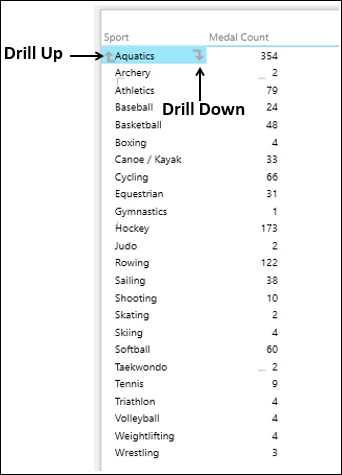
Click Level 2 data item for which you want further details. For example, click Aquatics. As you observe, the medal count for Aquatics is 354.
-
Click on the arrow to the right side of it.
-
Level 3 data pertaining to Aquatics will be displayed.
如你所观察,第一个项的左侧会出现一个向上箭头,表示向上钻取,当你单击各个数据项时,该项右侧会显示一个向下箭头,表示向下钻取。
As you observe, an upward arrow appears on the left side of the first item, indicating drill up and when you click on each of the data items, a downward arrow appears on the right side for that item indicating drill down.
现在,你可以按以下方式再向下钻取一层数据 −
Now, you can drill down the data one more level as follows −
-
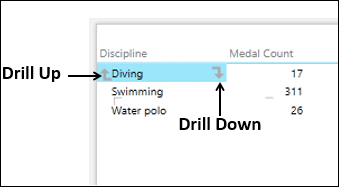
Click Level 3 data item for which you want further details. For e.g. click on Diving. As you observe, the medal count for Diving is 17.
-
Click on the arrow to the right side of it.
-
Level 4 data pertaining to Diving will be displayed.
如你所观察,第一个项的左侧会出现一个向上箭头,表示向上钻取,当你单击各个数据项时,该项右侧会显示一个向下箭头,表示向下钻取。
As you observe, an upward arrow appears on the left side of the first item, indicating drill up and when you click on each of the data items, a downward arrow appears on the right side for that item indicating drill down.
现在,你可以按以下方式再向下钻取一层数据 −
Now, you can drill down the data one more level as follows −
-
Click on the Level 4 data item for which you want further details. For example, click on 2008. As you observe, the medal count for 2008 is 3.
-
Click on the arrow to the right side of it.
-
Level 5 data pertaining to 2008 will be displayed.
如您所观察到的,对于第一个第 5 级数据项,左侧出现一个向上箭头,表示向上钻取。右侧不显示数据项的下钻箭头,因为存在要下钻到的其他级别。
As you observe, for the first Level 5 data item an upward arrow appears on the left side indicating drill up. Drill down arrows do not appear on the right side for the data items as there are further levels to drill down.
现在,您可以逐级向上钻取数据,方法是单击每个级别第一个项目左侧的向上箭头。
Now, you can drill up the data one level at a time by clicking on the upward arrow to the left side of the first item at each Level.
Exploring a Hierarchy in Stacked Bar Chart
您可能想要以重要方式突出显示层次结构中的某些值。在这种情况下,您可以使用图表可视化,例如,堆叠条形图如下 −
You might want to highlight certain values in a hierarchy in a significant way. In such a case, you can use a chart visualization, such as Stacked Bar chart as follows −
-
Click the Matrix visualization and switch to Stacked Bar Chart.
-
Drag the field Medal to LEGEND area.
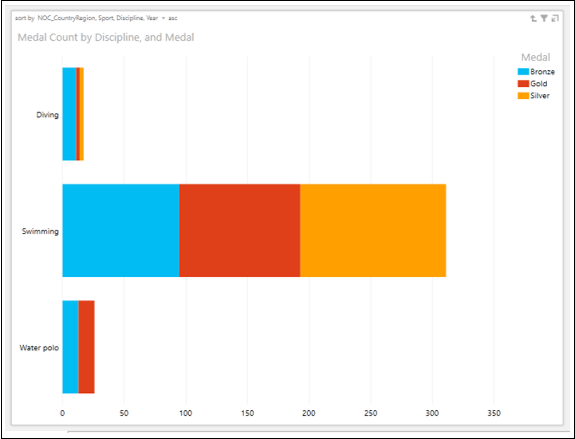
您将获得以下堆叠条形图可视化 −
You will get the Stacked Bar chart visualization as follows −
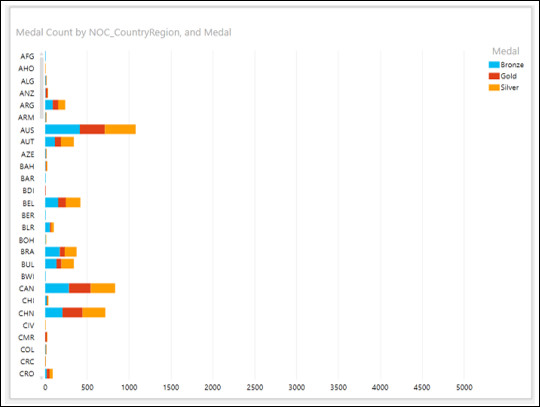
在这种情况下,您需要双击条形图才能下钻。
In this case, you need to double-click on a Bar to drill down.
双击代表 AUS 的条形图。图表已下钻以显示层次结构中下一级的数据。
Double-click on Bar representing AUS. The chart is drilled down to display the next level of data in the hierarchy.
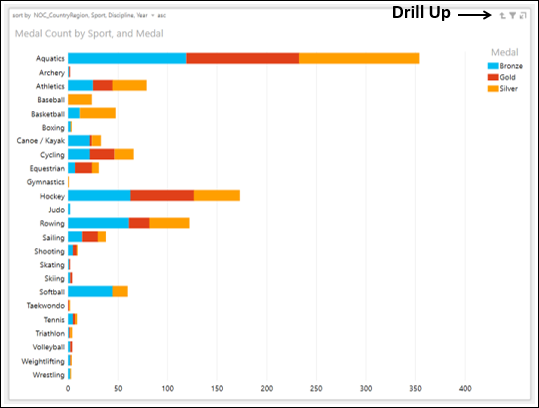
如您所观察到的,图表右上角会出现一个表示向上钻取的向上箭头。
As you can observe, an upward arrow indicating drill up appears at the top-right corner of the chart.
通过双击“Aquatics Bar”,向下钻取一个级别。图表已下钻以显示层次结构中下一级的数据。
Drill down one more level by double-clicking on Aquatics Bar. The chart is drilled down to display the next level of data in the hierarchy.
您可以通过双击条形图下钻,或者单击图表右上角的向上钻取箭头向上钻取。
You can drill down by double-clicking on a Bar or drill up by clicking on the drill up arrow on the top-right corner of the chart.
这还使您可以在演示过程中交互式地浏览数据。
This gives you an interactive exploration of data during presentation also.