Excel Data Analysis 简明教程
Exploring Data with Powerpivot
PowerPivot 是一个易于使用的从 Excel 中直接使用的 Data Analysis 工具。您可以使用 PowerPivot 访问和混合任何数据源中的数据。使用 PowerPivot 可以创建自己喜欢的报表。
PowerPivot is an easy to use Data Analysis tool that can be used from within Excel. You can use PowerPivot to access and mashup data from virtually any data source. You can create your own fascinating reports with PowerPivot.
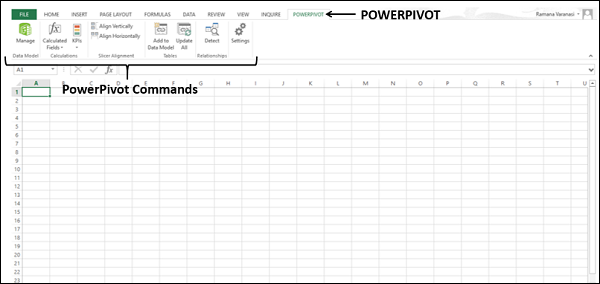
您可以通过 Ribbon 中的 PowerPivot 选项卡访问 PowerPivot 命令。点击 Ribbon 中的 PowerPivot 选项卡。PowerPivot 命令将显示在 Ribbon 中。您会注意到与数据模型有关的命令也将显示在这里。
You can access the PowerPivot commands from PowerPivot tab on the Ribbon. Click the PowerPivot tab on the Ribbon. The PowerPivot commands will be displayed on the Ribbon. You can observe that the commands related to Data Model also appear here.
Adding Tables to Data Model
如果您导入了表格,它们将添加到数据模型中。您可以通过 PowerPivot Ribbon 管理数据模型。您可以使用 PowerPivot 如下所示向数据模型中添加表格−
If you have imported tables, they are added to the Data Model. You can manage the Data Model from PowerPivot Ribbon. You can add tables to Data Model with PowerPivot as follows −
-
Insert a new worksheet in your workbook.
-
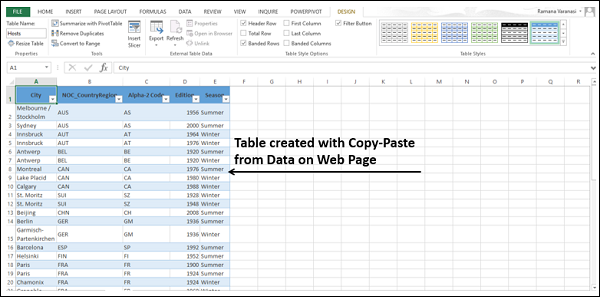
Copy data from the web page and paste it on the worksheet.
-
Create a table with the pasted data.
-
Name the table as Hosts.
-
Rename the worksheet as Hosts.
-
Click the table Hosts.
-
Click the POWERPIVOT tab on the Ribbon.
-
Click Add to Data Model in the Tables group.
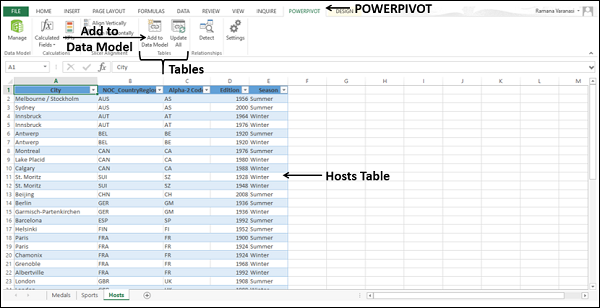
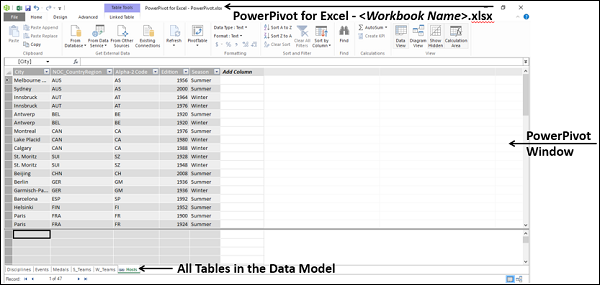
表格将添加到数据模型中。PowerPivot 窗口会出现。您可在数据模型表格中找到名为 Hosts 的表格。
The table is added to the Data Model. The PowerPivot window appears. You will find the table Hosts in the Data Model tables.
Viewing Tables in the Data Model
-
Click on the POWERPIVOT tab on the Ribbon.
-
Click on Manage in the Data Model group.
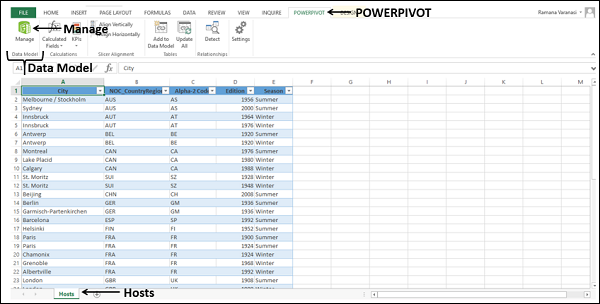
PowerPivot 窗口将以数据视图显示。
PowerPivot window appears, in Data View.
PowerPivot 有两种视图−
PowerPivot has two views −
-
Data View − It displays all the tables in the Data Model with fields displayed in columns and data as records in the rows, with a calculation area below each table. The table tabs look similar to the Excel worksheet tabs with names. You can move from table to table by clicking on the tabs.
-
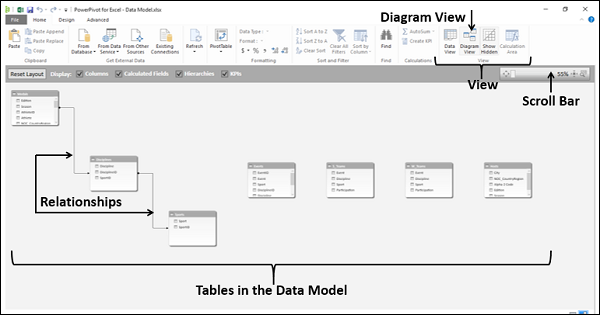
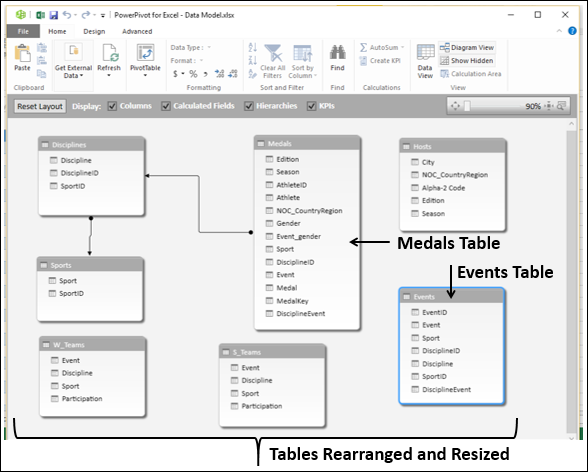
Diagram View − It displays all the tables as boxes with table name as caption and the fields listed in the box. You can drag the tables to align them, resize them to make all the fields visible, and create relationships by just clicking on the fields and connecting them with lines.
您将在后面的章节中更详细地了解图表视图和关系。
You will understand the Diagram View and the Relationships in detail in the later sections.
在此处,请注意 PowerPivot 窗口中显示数据模型中的所有表,无论它们是否作为工作簿中的工作表存在。
Here, observe that all the tables in the Data Model are visible in the PowerPivot window, irrespective of whether they are present as worksheets in the workbook or not.
Viewing Relationships between Tables
只有在表之间存在关系时,你才能使用来自不同表的数据进行分析和报告。
You can use the data from different tables for analysis and reporting only when relationships exist among them.
您可以在 PowerPivot 窗口中的图表视图中查看表之间的关系。
You can view the relationships between tables from the diagram view in the PowerPivot window.
-
Click Diagram View in the View group.
-
Resize the diagram using the scroll bar so that you can see all the tables in the Data Model in the diagram.
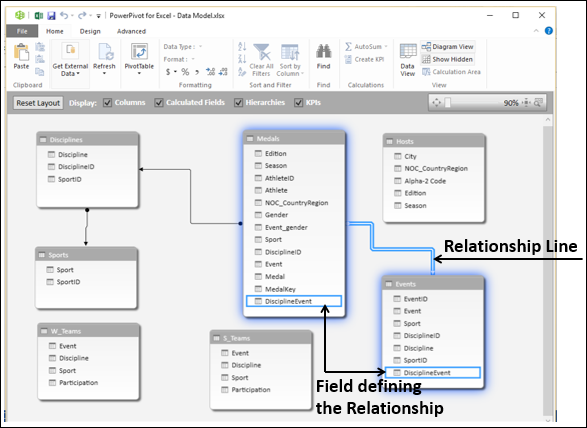
数据模型中的所有表均显示其字段列表。表之间的关系由连接它们的线条表示。
All the tables in the Data Model appear with their fields lists. The relationships among the tables are denoted by the lines connecting them.
Creating Relationships between Tables
您可能希望在 Medals 和 Events 表之间创建关系。为此,表中应具有一个公共字段,并且该字段在其中一个表中包含唯一值。首先,您需要验证这一点。
You might want to create a relationship between the tables – Medals and Events. In order to do this, there should be a field that is common in both the tables and contains unique values in one of the tables. First, you need to verify this.
-
Click the Data View in the View group.
-
Click the Events tab to view the Events table.
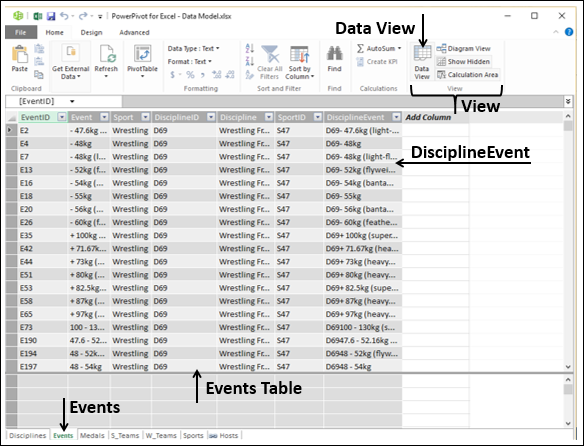
您可以观察到“事件”表中的 DisciplineEvent 字段具有唯一值(无重复值)。
You can observe that the field DisciplineEvent in the Events table has unique values (no duplicate values).
单击“奖牌”选项卡以查看“奖牌”表。DisciplineEvent 字段也可在 Medals 表中获得。因此,您可以使用 DisciplineEvent 字段创建关系,如下所示:
Click the Medals tab to view the Medals table. The field DisciplineEvent is available in the Medals table also. Hence, you can create a relationship using the field DisciplineEvent as follows −
-
Click Diagram View in the View group.
-
Rearrange the tables in the view by dragging them so that Events table and Medals table are close to each other.
-
Resize the tables so that all the fields are visible.
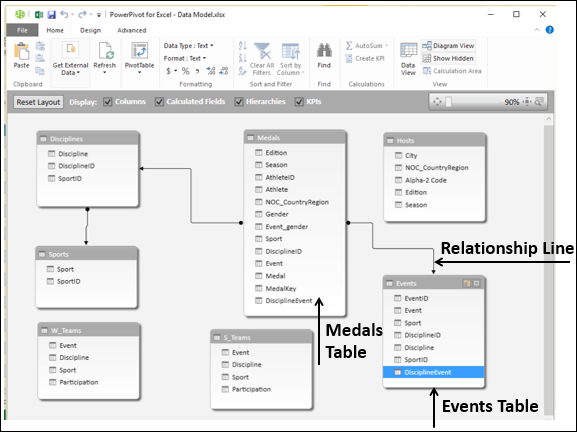
单击“事件”表中的 DisciplineEvent 字段,并将其拖到“奖牌”表中的 DisciplineEvent 字段。
Click the field DisciplineEvent in the Events table and Drag to the field DisciplineEvent in the Medals table.
在“事件”表和“奖牌”表之间出现一条线,表示已建立关系。
A line appears between the Events table and the Medals table, indicating that a relationship has been established.
Viewing the Field defining a Relationship
您可以查看用于创建两个表之间关系的字段。
You can view the field that is used to create the relationship between two tables.
单击连接两个表的关联线。将突出显示关联线和定义这两个表之间关系的字段。
Click the relationship line connecting the two tables. The relationship line and the field defining the relationship between the two tables get highlighted.