Excel Data Analysis 简明教程
Exploring Data with Power View Tiles
假设您有很多数据要使用不同的数据点显示,在这种情况下,您可能需要在 Power View 可视化中频繁滚动才能找到您要查找的数据。这会很繁琐,并且在您展示结果时可能也不太流畅。
Suppose you have lot of data to display with significant data points at varied places. In such a case, you might have to scroll very often in your Power View visualizations to find the data you are looking for. This would be tedious and also might not be smooth when you are presenting the results.
您可以使用 Power View 中的图块功能克服这种繁琐的任务。使用图块,您可以更快地从数据中获得见解。图块充当导航条,每个可能的字段值都有一个单独的图块。当您单击图块时,只会显示与该字段值相关的数据。由于在导航条中滚动值很容易,并且会动态改变可视化中相应的值,因此,图块成为您易于使用的工具。
You can overcome this drudgery, using the tile feature in Power View. With tiles, you can gain insights from your data much more quickly. Tiles act as navigation strips, with a single tile for each possible field value. When you click on a tile, only data related to that field value is displayed. As it is easy to scroll the values in the navigation strip that dynamically changes the corresponding values in the visualization, tiles become an easy to use tool for you.
您可以在表、矩阵、卡片或图表可视化中使用图块。您可以在 Power View 中组合这些图块并使用图块对其进行筛选。图块可以是简单的文本或图像。
You can have Tiles in a Table, Matrix, Card or Chart visualization. You can have a combination of these in Power View and get them filtered with Tiles. A Tile can be simple text or an image.
Table with Tiles
按以下步骤从表可视化开始:
Start with a Table Visualization as follows −
-
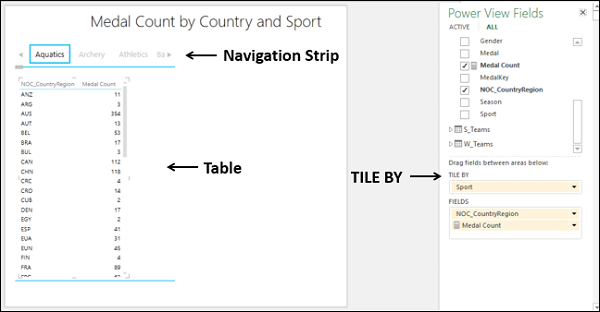
Drag the fields NOC_CountryRegion, Sport and Medal Count to Power View. As you observe, as the number of rows is large, it is difficult to scroll up and down to highlight values.
-
Drag the field Sport from FIELDS area to TILE BY area in the Power View Fields list.
导航条出现在表的顶部。
Navigation Strip appears at the top of the Table.
您可以观察到以下内容 −
You can observe the following −
-
By default, the first Tile in the Navigation Strip is selected.
-
In the Table, the values are filtered to that of the Tile selected. In this case, the Sport that is selected.
-
There are arrow buttons at the left and right edges of the Navigation strip to enable scrolling.
您可以按以下步骤选择不同的图块:
You can select a different Tile as follows −
-
Scroll the Navigation Strip to display the Tile representing the Sport you are looking for, for e.g. Badminton.
-
Click the Tile – Badminton. The values in the Table are filtered to those of Badminton.
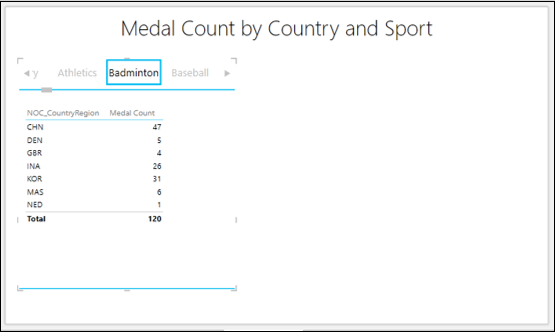
您可以观察到,还会显示奖牌计数总数。您可以选择从功能区打开或关闭总数。您还可以通过用图像代替文本,使图块更具吸引力和更有意义。
You can observe the medal count Total is also displayed. You have an option to turn Totals on or off from the Ribbon. You also can make the Tiles more appealing and meaningful by having images in place of Text.
-
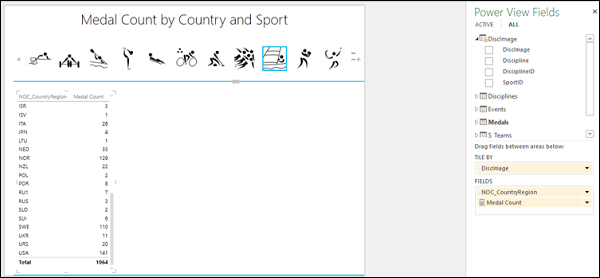
Include a column that has hyperlinks to the image files corresponding to each of the Sports.
-
Include that field, for e.g. Discimage in TILE BY. You will get the Tiles as images, portraying each sport.
Tile Navigation Strip - Tab Strip
Excel 中有两种导航条——图块流和选项卡条。
There are two types of navigation strips in Excel - Tile Flow and Tab Strip.
在选项卡条中,您可以观察到以下内容:
In a Tab strip, you can observe the following −
-
Tab strip displays the navigation strip across the top of the Visualization.
-
By default, the first Tile in the navigation strip that is the leftmost is selected.
-
There are arrow buttons at the left and right edges of the navigation strip to enable scrolling.
-
You can scroll to the left or right to display the Tiles.
-
The highlighted Tile moves to the left or right as you scroll the tab strip. It can also go out of view, while scrolling.
-
You can click on a Tile to select it. The Tile gets highlighted at the same position as it was before.
-
In the Table, the values are filtered to that of the Tile selected. In this case, the Sport that is selected.
Tile Navigation Strip - Tile Flow
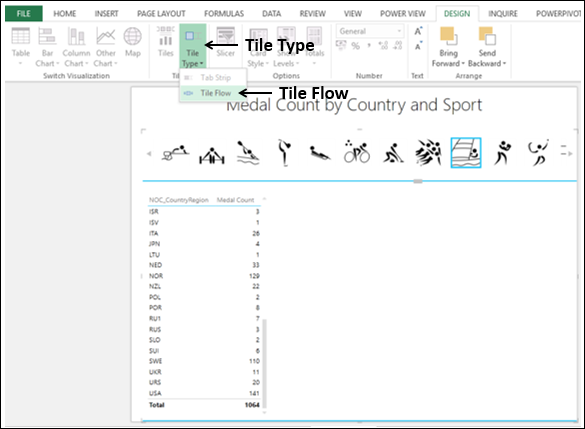
您可以按如下操作将导航条从选项卡条转换为图块流:
You can covert the navigation strip from tab strip to tile flow as follows −
-
Click a Tile on the navigation strip.
-
Click the DESIGN tab on the Ribbon.
-
Click Tile Type in the Tiles group.
-
Click Tile Flow in the dropdown list.
导航条移至表格底部。
The navigation strip shifts to the bottom of the Table.
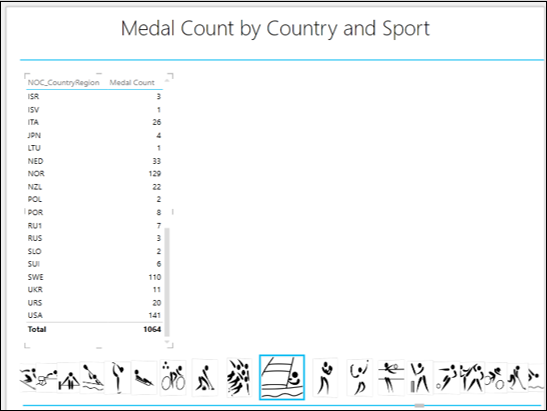
在图块流中,您可以观察到以下内容:
In a Tile Flow, you can observe the following −
-
Tile flow displays the navigation strip across the bottom of the Visualization.
-
By default, the first Tile in the navigation strip is selected. It will be displayed at the center of the tile flow.
-
There are no arrow buttons for scrolling.
-
You can scroll to the left or right by clicking on any of the Tiles to the left or right of the center Tile.
-
The Tiles flow to the left or right and the center Tile will always get highlighted.
-
You can click on a Tile to select it. The Tile gets highlighted and moves to the center of the Tile flow.
-
As the selected Tile is always the center Tile, the following happens − Selected Tile does not go out of view. When you scroll to the left or right, the Tile that comes to the center position gets automatically selected and highlighted. The original selection disappears. The Visualization, Table in this case, automatically is updated to the Tile in the center of the Tile flow.
-
In the Table, the values are filtered to that of the Tile selected. In this case, the Sport that is selected.

Matrix with Tiles
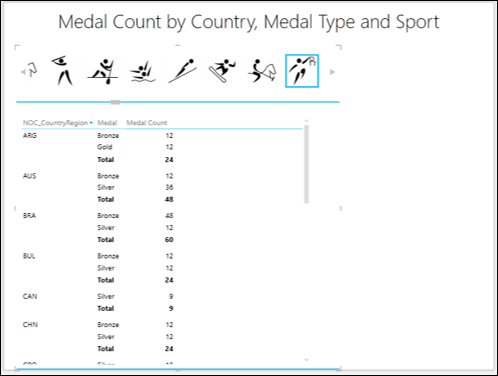
假设您想要根据奖牌类型(金牌、银牌和铜牌)以及某个选定运动的国家/地区来统计奖牌数量,则可以在矩阵平铺可视化效果中显示结果。
Suppose you want the medal count by medal type – Gold, Silver and Bronze and also the total medal count, by country for a selected sport, you can display the results in a Matrix Tile visualization.
-
Switch Visualization to Matrix.
-
Add the field Medal to Matrix.
您将获得以下所需结果:-
You will get the desired results as follows −