Matplotlib 简明教程
Matplotlib - Arrows
What are Arrows in Matplotlib?
在 Matplotlib 库中, Arrows 指示用来指示方向、点之间的连接和突出绘图中特定特征的图形元素。可以使用 plt.arrow() 函数向绘图添加箭头,或者通过使用 plt.annotate() 函数将其合并到注释中。
In Matplotlib library Arrows refer to the graphical elements used to indicate direction, connection between points and to highlight specific features within plots. Arrows can be added to plots using the plt.arrow() function or incorporated within annotations by using the plt.annotate() function.
Matplotlib 库中的箭头是可视化描绘方向性、连接或绘图中突出内容的通用元素,有助于更好地在可视化中传达信息。我们可以调整坐标、长度、颜色和样式等参数,以满足特定的可视化需求。
Arrows in Matplotlib library are versatile elements used to visually depict directionality, connections or highlights within the plots for aiding in better communication of information in visualizations. We can adjust parameters like coordinates, lengths, colors and styles to suit the specific visualization needs.
matplotlib 库中的 plt.arrow() 函数在绘图上的两个点之间创建箭头。
The plt.arrow() function in matplotlib library creates arrows between two points on a plot.
Syntax
以下是 plt.arrow() 函数的语法和参数。
The following is the syntax and parameters of the plt.arrow() function.
plt.arrow(x, y, dx, dy, kwargs)其中,
Where,
-
x, y − These are the starting point coordinates of the arrow.
-
dx, dy − These are lengths of the arrow in the x and y directions.
-
kwargs − We can add additional keyword arguments to customize arrow properties such as color, width, style etc.
Adding arrows to the line plot
在这个示例中,我们利用 plt.arrow() 函数,通过绘制两点之间的箭头,绘制出一个箭头图。传递 x, y, dx 和 dy 点作为输入参数,按照这些指定的点创建箭头。此外,我们还传递了箭头长度、宽度和颜色的参数。
In this example we are plotting a plot by creating the arrows between the given two points on the plot by using the plt.arrow() function. To this function we passed the x, y, dx and dy points as input parameters for creating arrows in those mentioned points. In addition we passed the parameters such as length, width and color of the arrow.
import matplotlib.pyplot as plt
# Creating a line plot
plt.plot([0, 1], [0, 1])
# Adding an arrow
plt.arrow(0.2, 0.2, 0.4, 0.4, head_width=0.05, head_length=0.1, fc='red', ec='blue')
plt.xlabel('X-axis')
plt.ylabel('Y-axis')
plt.title('Arrow created by using plt.arrow() function')
# show grid of the plot
plt.grid(True)
plt.show()
Adding arrow separately
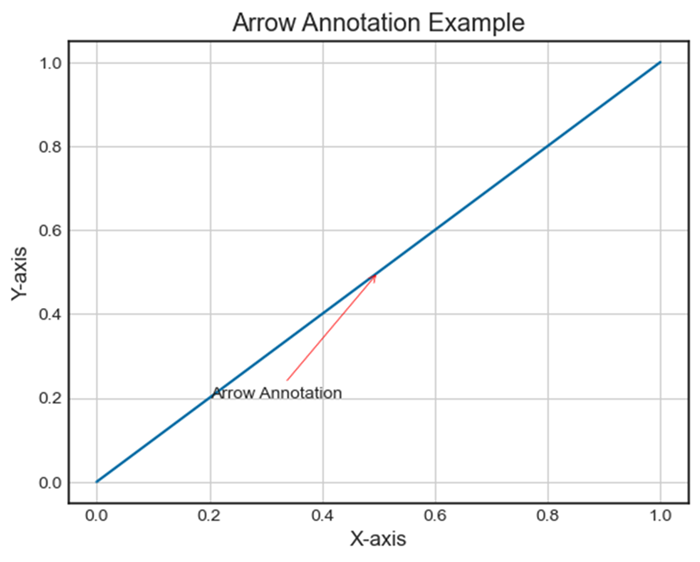
这里有另一个创建箭头的示例。众所周知,可以使用 plt.annotate() 中的 arrowprops 来定义箭头样式,将箭头集成到注释中。在这个示例中, 'Arrow Annotation' 通过 arrowprops 中指定的箭头样式与点 (0.5, 0.5) 相连。
Here this is another example of creating the arrows. As we know arrows can also be integrated into annotations using plt.annotate() by specifying arrowprops to define arrow styles. In this example 'Arrow Annotation' is connected to point (0.5, 0.5) with an arrow style specified by arrowprops.
import matplotlib.pyplot as plt
# Creating a plot
plt.plot([0, 1], [0, 1])
# Adding an arrow with annotation
plt.annotate('Arrow Annotation', xy=(0.5, 0.5), xytext=(0.2, 0.2), arrowprops=dict(facecolor='yellow',ec = 'red', arrowstyle='->'))
plt.xlabel('X-axis')
plt.ylabel('Y-axis')
plt.title('Arrow Annotation Example')
# Displaying the grid
plt.grid(True)
plt.show()
Plotting distance arrows in technical drawing
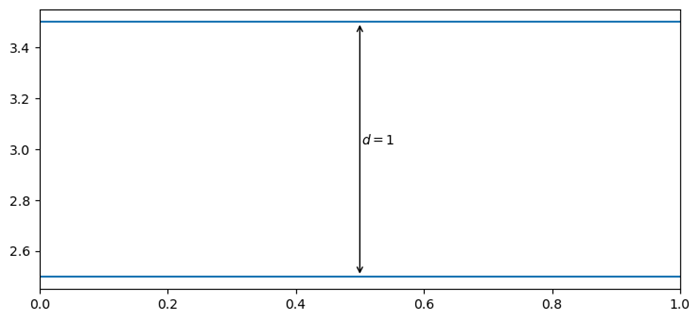
要使用箭头属性在 Matplotlib 中绘制技术制图中的距离箭头,我们可以使用 annotate() 方法。
To plot the distance arrows in technical drawing in matplotlib we can use annotate() method with arrow properties.
from matplotlib import pyplot as plt
plt.rcParams["figure.figsize"] = [7.50, 3.50]
plt.rcParams["figure.autolayout"] = True
plt.axhline(3.5)
plt.axhline(2.5)
plt.annotate(
   '', xy=(0.5, 3.5), xycoords='data',
   xytext=(0.5, 2.5), textcoords='data',
   arrowprops={'arrowstyle': '<->'})
plt.annotate(
   '$\it{d=1}$', xy=(0.501, 3.0), xycoords='data',
   xytext=(0.5, 3.5), textcoords='offset points')
plt.show()