Matplotlib 简明教程
Matplotlib - Event Handling
在一般编程中, event 定义为对象状态的变化,它发生在用户与图形用户界面组件交互时,触发应用程序的响应。考虑以下操作:单击按钮、移动鼠标、在键盘上打字、从列表中选择一项或滚动页面 - 其中每项活动都是一个事件,描述源的状态变化。
In general programming, an event is defined as the change in the state of an object, that occurs when a user interacts with graphical user interface components, triggering a response from the application. Consider actions like clicking a button, moving the mouse, typing on the keyboard, selecting an item from a list, or scrolling a page - each of these activities is an event, describing a change in the state of the source.
而 event handling 是交互式软件应用程序的主干。它是控制对这些事件的响应的机制,确定在特定事件发生时应该发生什么。
Whereas, event handling is the backbone of interactive software applications. Which is the mechanism that controls the response to these events, determining what should occur when a particular event takes place.
Event Handling in Matplotlib
Matplotlib 与各种用户界面工具包配合使用,包括 wxPython、Tkinter、Qt、GTK 和 MacOSX。为了确保对不同界面中的交互式功能(如平移和缩放)提供一致的支持,Matplotlib 使用 GUI-neutral 事件处理 API。该 API 最初基于 GTK 模型,它是 Matplotlib 支持的第一个用户界面。
Matplotlib works with various user interface toolkits, including wxPython, Tkinter, Qt, GTK, and MacOSX. To ensure consistent support for interactive features like panning and zooming across different interfaces, Matplotlib uses a GUI-neutral event handling API. This API was initially based on the GTK model, which was the first user interface Matplotlib supported.
Connecting to Events
在 Matplotlib 中 event handling 背后的主要思想是将回调函数连接到事件。在特定事件(例如鼠标单击或按键)发生时,将执行回调函数。此机制使您能够响应用户交互并实现自定义行为。
The main idea behind event handling in Matplotlib is connecting a callback functions to events. A callback function is executed when a specific event, such as a mouse click or key press, occurs. This mechanism enables you to respond to user interactions and implement customized behavior.
如果需要,您可以使用从 mpl_connect 方法获取的连接 ID 断开回调。
If needed, you can disconnect the callback using the connection ID obtained from the mpl_connect method.
fig.canvas.mpl_disconnect(cid)Example
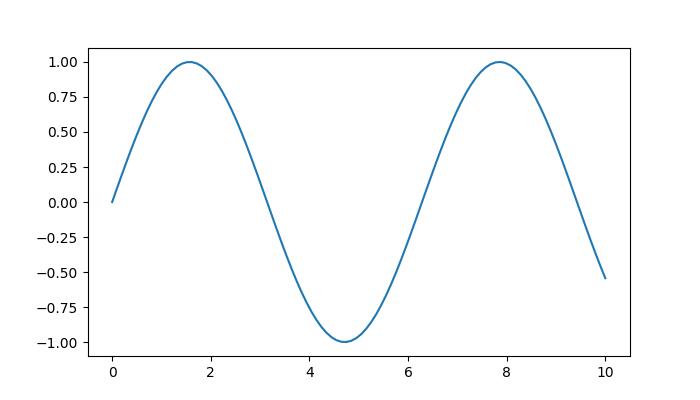
此示例演示了在 Matplotlib 图上打印鼠标点击位置和已按按钮的基本实现。
This example demonstrates a basic implementation that prints the mouse click location and the pressed button on a Matplotlib plot.
import matplotlib.pyplot as plt
import numpy as np

# Generate sample data
x = np.linspace(0, 10, 100)
y = np.sin(x)

# Create a Matplotlib figure and axis
fig, ax = plt.subplots(figsize=(7, 4))

# Plot the data
ax.plot(x, y)

# Define a callback function to handle events
def onclick(event):
   print('%s click: button=%d, x=%d, y=%d, xdata=%f, ydata=%f' %
      ('double' if event.dblclick else 'single', event.button,
      event.x, event.y, event.xdata, event.ydata))

# Connect the event handler to the figure canvas
cid = fig.canvas.mpl_connect('button_press_event', onclick)

plt.show()
在执行上述程序后,你将获得以下输出 -
On executing the above program you will get the following output −

single click: button=1, x=271, y=266, xdata=3.220737, ydata=0.485644
single click: button=1, x=218, y=226, xdata=2.146083, ydata=0.200062
single click: button=3, x=218, y=226, xdata=2.146083, ydata=0.200062
single click: button=1, x=360, y=245, xdata=5.025346, ydata=0.335713
观看下面的视频来观察此示例的工作。
Watch the video below to observe the works of this example.

Common Events in Matplotlib
Matplotlib 支持多种事件,每个事件由特定类表示 −
Matplotlib supports various events, each represented by a specific class −
-
button_press_event − Triggered when a mouse button is pressed.
-
button_release_event − Triggered when a mouse button is released.
-
close_event − Triggered when the figure is closed.
-
draw_event − Triggered when the canvas has been drawn but the screen widget is not updated.
-
key_press_event − Triggered when a key is pressed.
-
key_release_event − Triggered when a key is released.
-
motion_notify_event − Triggered when the mouse moves.
-
pick_event − Triggered when an artist in the canvas is selected.
-
resize_event − Triggered when the figure canvas is resized.
-
scroll_event − Triggered when the mouse scroll wheel is rolled.
-
figure_enter_event − Triggered when the mouse enters a new figure.
-
figure_leave_event − Triggered when the mouse leaves a figure.
-
axes_enter_event − Triggered when the mouse enters a new axes.
-
axes_leave_event − Triggered when the mouse leaves an axes.
通过使用这些事件,你可以在 matplotlib 中创建动态的互动可视化。
By using these events, you can create dynamic and interactive visualizations in matplotlib.
Event Attributes
所有 Matplotlib 事件从 matplotlib.backend_bases.Event 类继承,该类具有 name 、 canvas 和 guiEvent 等属性。 MouseEvent 的常见属性包括 x 、 y 、 inaxes 、 xdata 和 ydata 。
All Matplotlib events inherit from the matplotlib.backend_bases.Event class, which has attributes like name, canvas, and guiEvent. Common attributes for MouseEvent include x, y, inaxes, xdata, and ydata.
Example
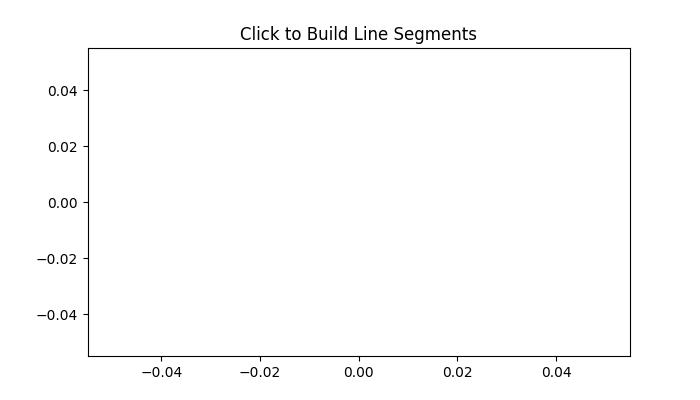
我们来看一个简单的例子,在该例子中,每次按下绘图上的鼠标都会生成线段。
Let’s see this simple example where a line segment is generated with each mouse press on the plot.
from matplotlib import pyplot as plt
import numpy as np

# LineBuilder Class
# It creats line segments based on mouse clicks.
class LineBuilder:
   def __init__(self, line):
      self.line = line
      self.xs = list(line.get_xdata())
      self.ys = list(line.get_ydata())
      self.cid = line.figure.canvas.mpl_connect('button_press_event', self)

   def __call__(self, event):
      if event.inaxes != self.line.axes:
         return
      self.xs.append(event.xdata)
      self.ys.append(event.ydata)
      self.line.set_data(self.xs, self.ys)
      self.line.figure.canvas.draw()

# Create a figure and axis
fig, ax = plt.subplots(figsize=(7, 4))

# Set the title
ax.set_title('Click to Build Line Segments')

# empty line
line, = ax.plot([0], [0])

# Create an instance for LineBuilder class
linebuilder = LineBuilder(line)

# Show the Plot
plt.show()
执行上述程序后你会得到以下图形,点击该图形观察该例子的执行过程 −
On executing the above program you will get the following figure click on this figure to observe the working of this example −

观看下方视频,观察该例子的执行过程。
Watch the video below to observe working of this example.

Detecting the Mouse moves
如果您想检测鼠标何时进入或离开图形或轴,可以连接至图形/轴进入/离开事件。
To detect when the mouse enters or leaves a figure or an axes, we can connect to the figure/axes enter/leave events.
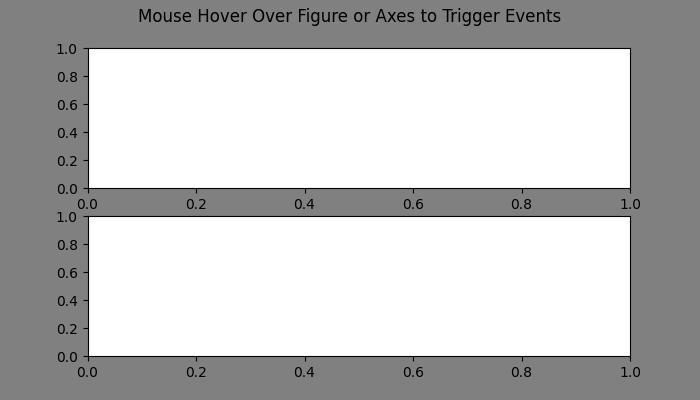
以下的另外一个示例演示了当鼠标进入或离开图形的特定区域时如何更改边框颜色。
Here is another example that demonstrates how to change frame colors when the mouse enters or leaves specific regions of the figure.
import matplotlib.pyplot as plt

def enter_axes(event):
   event.inaxes.patch.set_facecolor('yellow')
   event.canvas.draw()

def leave_axes(event):
   event.inaxes.patch.set_facecolor('white')
   event.canvas.draw()

def enter_figure(event):
   event.canvas.figure.patch.set_facecolor('red')
   event.canvas.draw()

def leave_figure(event):
   event.canvas.figure.patch.set_facecolor('grey')
   event.canvas.draw()

fig, axs = plt.subplots(2, figsize=(7, 4))
fig.suptitle('Mouse Hover Over Figure or Axes to Trigger Events')

fig.canvas.mpl_connect('figure_enter_event', enter_figure)
fig.canvas.mpl_connect('figure_leave_event', leave_figure)
fig.canvas.mpl_connect('axes_enter_event', enter_axes)
fig.canvas.mpl_connect('axes_leave_event', leave_axes)

plt.show()
在执行上述程序后,你将获得以下输出 -
On executing the above program you will get the following output −

观看下面的视频来观察此示例的工作。
Watch the video below to observe the works of this example.

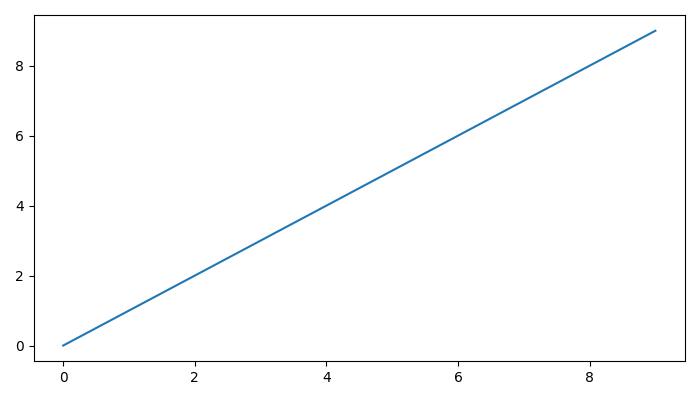
以下的另外一个示例演示了如何使用 Matplotlib 显示鼠标释放事件坐标
Here is another example that demonstrates how to show mouse release event coordinates with Matplotlib
from matplotlib import pyplot as plt

plt.rcParams['backend'] = 'TkAgg'
plt.rcParams["figure.figsize"] = [7, 4]
plt.rcParams["figure.autolayout"] = True

# Define a callback function to handle events
def onclick(event):
   print(event.button, event.xdata, event.ydata)

# Create a Matplotlib figure and axis
fig, ax = plt.subplots()

# Plot the data
ax.plot(range(10))

# Connect the event handler to the figure canvas
fig.canvas.mpl_connect('button_release_event', onclick)

# Show the Plot
plt.show()
执行上述代码,我们将得到以下输出 −
On executing the above code we will get the following output −

观看下面的视频来观察此示例的工作。
Watch the video below to observe the works of this example.
