Matplotlib 简明教程
Matplotlib - Image Masking
在 Matplotlib 库中,图像遮罩涉及根据指定掩码有选择地显示图像的部分,该掩码本质上是定义要显示或隐藏的区域的二进制图像。它允许我们应用过滤器或条件以显示或隐藏图像的特定部分。
In Matplotlib library image masking involves selectively displaying parts of an image based on a specified mask which is essentially a binary image defining regions to be shown or hidden. It allows us to apply a filter or condition to reveal or hide specific portions of an image.
Process of Image Masking
以下是执行图像遮罩的步骤:
The below are the process steps for performing Image Masking.
Create a Mask
-
定义创建遮罩的条件或模式。它可以基于颜色、形状、渐变或特定像素值。
Define the criteria or pattern to create the mask. It can be based on colors, shapes, gradients or specific pixel values.
Apply the Mask
-
使用遮罩修改原始图像中相应像素的透明度或可见性。与遮罩中定义为 "masked" 的区域相对应的像素通常隐藏或变为透明,而其他像素则保持可见。
Use the mask to modify the transparency or visibility of the corresponding pixels in the original image. Pixels that correspond to areas defined in the mask as "masked" are usually hidden or made transparent while others remain visible.
Types of Image Masks
以下是图像遮罩的类型:
The below are the types of Image masks.
Binary Masks
-
由黑色和白色像素组成,其中白色代表可见区域,黑色代表遮罩区域。
Consist of black and white pixels where white represents visible areas and black represents masked areas.
Grayscale Masks
-
使用各种深浅的灰色来定义透明度或部分可见性的级别。
Use various shades of gray to define levels of transparency or partial visibility.
Tools and Techniques for Image Masking
我们可以使用不同的工具和技术进行图像遮罩。
We can use the different tools and techniques for Image masking.
Manual Masking
-
像 Photoshop 或 GIMP 这样的工具允许用户使用选择工具、画笔或图层蒙版手动创建和编辑遮罩。
Tools like Photoshop or GIMP allow users to manually create and edit masks using selection tools, brushes or layer masks.
Programmatic Masking
-
在使用 OpenCV 或 PIL (Pillow) 等库的 Python 等编程语言中,我们可以使用基于颜色阈值、轮廓或特定图像特征的算法创建遮罩。
In programming languages like Python with libraries such as OpenCV or PIL (Pillow) we can create masks using algorithms based on color thresholds, contours or specific image features.
Key Points
-
Image masking in Matplotlib involves creating a mask array with the same dimensions as the image where specific regions are marked to hide (masked) or reveal (unmasked) portions of the image.
-
Masking arrays consist of boolean or numerical values where True or non-zero values indicate the regions to be displayed, and False or zero values indicate the regions to be hidden.
-
Masking allows for selective visualization or manipulation of specific parts of an image based on specified conditions or criteria.
Masking the particular region of the Image
假设我们有一张图像,并希望遮罩特定区域,仅基于某些标准显示图像的一部分。
Let’s say we have an image and want to mask a particular region displaying only a portion of the image based on certain criteria.
import matplotlib.pyplot as plt
import numpy as np

# Create a sample image (random pixels)
image = np.random.rand(100, 100)

# Create a mask to hide certain parts of the image
mask = np.zeros_like(image)
mask[30:70, 30:70] = 1  # Masking a square region

# Apply the mask to the image
masked_image = np.ma.masked_array(image, mask=mask)

# Display the original and masked images
plt.figure(figsize=(8, 4))
plt.subplot(1, 2, 1)
plt.imshow(image, cmap='gray')
plt.title('Original Image')
plt.axis('off')
plt.subplot(1, 2, 2)
plt.imshow(masked_image, cmap='gray')
plt.title('Masked Image')
plt.axis('off')
plt.show()
Applying mask to an Image
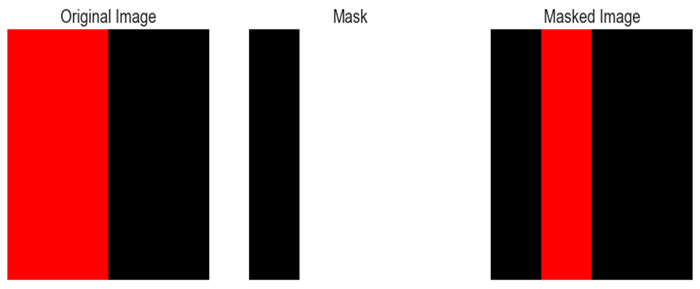
在本文中,这是使用 matplotlib 库遮罩图像的另一种方法。
Here this is another of masking an image using the matplotlib library.
import matplotlib.pyplot as plt
import numpy as np

# Create a sample image
image_size = 100
img = np.zeros((image_size, image_size, 3), dtype=np.uint8)
img[:, :image_size // 2] = [255, 0, 0]  # Set the left half to blue

# Create a binary mask
mask = np.zeros((image_size, image_size), dtype=np.uint8)
mask[:, image_size // 4:] = 1  # Set the right quarter to 1

# Apply the mask to the image
masked_img = img * mask[:, :, np.newaxis]

# Display the original image, mask, and the masked image
plt.figure(figsize=(12, 4))
plt.subplot(131)
plt.imshow(img)
plt.title('Original Image')
plt.axis('off')
plt.subplot(132)
plt.imshow(mask, cmap='gray')
plt.title('Mask')
plt.axis('off')
plt.subplot(133)
plt.imshow(masked_img)
plt.title('Masked Image')
plt.axis('off')
plt.show()