Matplotlib 简明教程
Matplotlib - Setting Ticks and Tick Labels
刻度是标记轴上数据点的标记。到目前为止,在所有之前的示例中,Matplotlib 一直自动执行在轴上对点进行间距的任务。Matplotlib 的默认刻度定位器和格式化程序设计为在许多常见情况下通常足够。可以明确提及刻度的位置和标签,以满足特定要求。
Ticks are the markers denoting data points on axes. Matplotlib has so far - in all our previous examples - automatically taken over the task of spacing points on the axis.Matplotlib’s default tick locators and formatters are designed to be generally sufficient in many common situations. Position and labels of ticks can be explicitly mentioned to suit specific requirements.
xticks() 和 yticks() 函数采用列表对象作为参数。列表中的元素表示将显示刻度的相应操作的位置。
The xticks() and yticks() function takes a list object as argument. The elements in the list denote the positions on corresponding action where ticks will be displayed.
ax.set_xticks([2,4,6,8,10])此方法将用刻度标记给定位置的数据点。
This method will mark the data points at the given positions with ticks.
类似地,可以通过 set_xlabels() 和 set_ylabels() 函数分别设置与刻度标记对应的标签。
Similarly, labels corresponding to tick marks can be set by set_xlabels() and set_ylabels() functions respectively.
ax.set_xlabels([‘two’, ‘four’,’six’, ‘eight’, ‘ten’])这将在 x 轴上的标记下面显示文本标签。
This will display the text labels below the markers on the x axis.
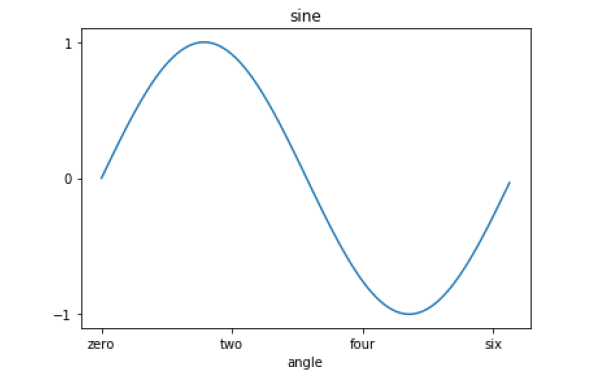
以下示例演示了刻度和标签的使用。
Following example demonstrates the use of ticks and labels.
import matplotlib.pyplot as plt
import numpy as np
import math
x = np.arange(0, math.pi*2, 0.05)
fig = plt.figure()
ax = fig.add_axes([0.1, 0.1, 0.8, 0.8]) # main axes
y = np.sin(x)
ax.plot(x, y)
ax.set_xlabel(‘angle’)
ax.set_title('sine')
ax.set_xticks([0,2,4,6])
ax.set_xticklabels(['zero','two','four','six'])
ax.set_yticks([-1,0,1])
plt.show()