Matplotlib 简明教程
Matplotlib - Keypress Event
在计算机编程中,检测和处理 keypress events 是捕捉用户输入和启用应用程序中各种功能的基础。无论是浏览菜单、输入文本、触发动作还是控制交互元素,按键事件在用户交互中起着至关重要的作用。
In computer programming, the detection and handling of keypress events are fundamental for capturing user input and enabling various functionalities within applications. Whether it’s navigating through menus, entering text, triggering actions, or controlling interactive elements, keypress events play a crucial role in user interaction.
Matplotlib 提供了处理按键事件的工具,使您能够捕获和响应交互式绘图会话期间的键盘输入。当按下键时,Matplotlib 将触发 key_press_event ,允许用户根据按下的键定义自定义操作。
Matplotlib provides the tools for handling the keypress events, allowing you to capture and respond to keyboard inputs during interactive plotting sessions. When a key is pressed, Matplotlib triggers the key_press_event, allowing users to define custom actions based on the pressed keys.
该库默认附加一些按键回调,以增强交互性。这些默认回调在 Matplotlib 文档的键盘导航快捷方式部分中进行了记录。
The library attaches some keypress callbacks by default for enhanced interactivity. These default callbacks are documented in the Navigation keyboard shortcuts section of the Matplotlib documentation.
Example
让我们看看此基本示例,它演示了 Matplotlib 中的默认按键事件。
Let’s see this basic example, which demonstrates the default keypress events in Matplotlib.
import numpy as np
import matplotlib.pyplot as plt
# Define a function to handle keypress events
def press(event):
print('You pressed:', event.key)
# Create a Matplotlib figure and axis
fig, ax = plt.subplots()
# Connect the keypress event handler to the figure canvas
cid = fig.canvas.mpl_connect('key_press_event', press)
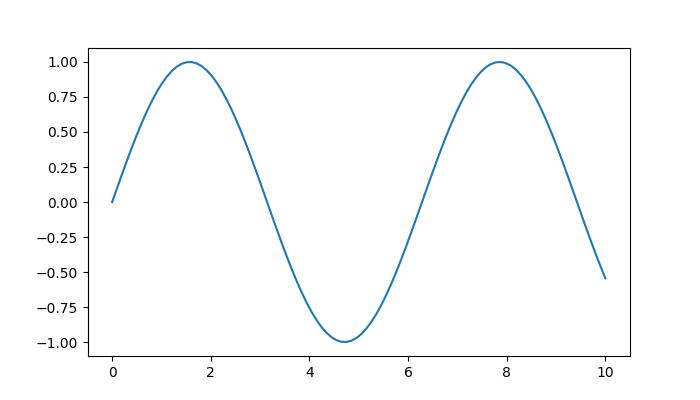
# Plot sin wave
x = np.linspace(0, 10, 100)
ax.plot(x, np.sin(x))
# Display the plot
plt.show()Output
在执行上述程序时,您将得到以下图像,并且按下任何键以观察此示例的工作 −
On executing the above program you will get the following figure, and press any key to observe the working of this example −
You pressed: tab
You pressed: caps_lock
You pressed: shift
You pressed: control
You pressed: alt
You pressed: meta
You pressed: a
You pressed: b
You pressed: c
You pressed: d
You pressed: s
You pressed: g
You pressed: g
You pressed: g
You pressed: g
You pressed: k
You pressed: k
You pressed: k
You pressed: k
You pressed: k
You pressed: k
You pressed: l
You pressed: l
You pressed: p
You pressed: p
You pressed: q
观看下面的视频,了解此按键事件功能在此处的工作方式。
Watch the video below to observe how this keypress event feature works here.

从以上输出中,您可以观察到一些默认键,如“g”(切换网格,“s”(保存图像,“q”(关闭图像)等。
From the above output, you can observe the working of some of the default keys like 'g' (toggling the grid), 's' (saving the figure), 'q' (closing the figure), and more.
Creating a Custom Keypress Event Function
要根据特定需求处理按键事件,您可以创建自定义函数,并使用 mpl_connect 方法将它连接到 key_press_event 。
To handle keypress events to specific needs, you can create a custom function and connect it to the key_press_event using the mpl_connect method.
Example
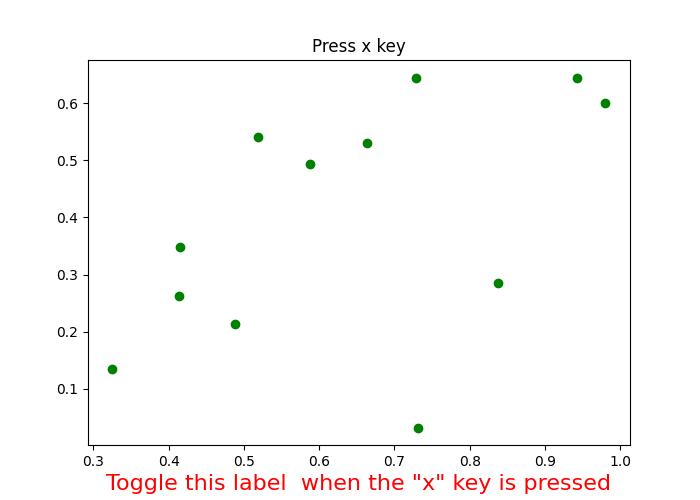
以下示例演示了一个简单的按键事件函数,当按下“x”键时,该函数切换 x 轴标签的可见性。
The following example demonstrates a simple keypress event function that toggles the visibility of an xlabel when the 'x' key is pressed.
import sys
import matplotlib.pyplot as plt
import numpy as np

def on_press(event):
   print('Pressed key:', event.key)
   sys.stdout.flush()

   # Toggle visibility of xlabel when 'x' key is pressed
   if event.key == 'x':
      visible = xl.get_visible()
      xl.set_visible(not visible)
      fig.canvas.draw()

fig, ax = plt.subplots()
fig.canvas.mpl_connect('key_press_event', on_press)

# Plot random data points
ax.plot(np.random.rand(12), np.random.rand(12), 'go')
xl = ax.set_xlabel('Toggle this label  when the "x" key is pressed',
   fontsize=16, color='red')
ax.set_title('Press x key')

plt.show()
在执行上述程序时,您将得到以下图像,并且按下任何键以观察此示例的工作 −
On executing the above program you will get the following figure, and press any key to observe the working of this example −
Pressed key: x
Pressed key: x
Pressed key: x
Pressed key: x
Pressed key: a
Pressed key: enter
观看下面的视频,了解此按键事件功能在此处的工作方式。
Watch the video below to observe how this keypress event feature works here.

Example
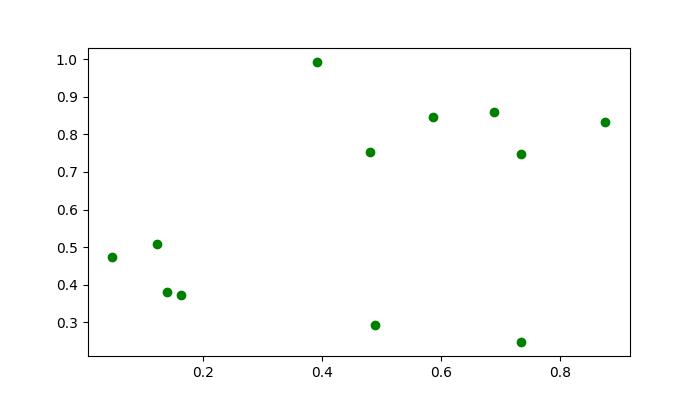
这是另一个示例,它演示了如何添加 escape 键来退出图像除了 "q" 键,并且它还会计算 enter 键按下的次数。
Here is another example that demonstrates how to add the escape key to exit the figure in addition to the "q" key and also it calculates the how many number of times the enter key is pressed.
import numpy as np
import matplotlib.pyplot as plt

# Define a function to handle keypress events
def press(event):
   print('Pressed key:', event.key)

   # If the 'enter' key is pressed, append 1 to the count list
   if event.key == 'enter':
      cnt.append(1)

   # If the 'escape' key is pressed, close the plot
   if event.key == "escape":
      plt.close()

cnt = []

# Create a figure
fig, ax = plt.subplots()

# Connect the keypress event handler to the figure canvas
fig.canvas.mpl_connect('key_press_event', press)
ax.plot(np.random.rand(12), np.random.rand(12), 'go')
plt.show()

# Calculate and print the sum of counts
result = sum(cnt)
print(result, cnt)
在执行上述程序时,您将得到以下图像,并且按下任何键以观察此示例的工作 −
On executing the above program you will get the following figure, and press any key to observe the working of this example −
Pressed key: b
Pressed key: enter
Pressed key: enter
Pressed key: caps_lock
Pressed key: caps_lock
Pressed key: enter
Pressed key: escape
3 [1, 1, 1]