Matplotlib 简明教程
Matplotlib - Enabling LaTex Rendering in Annotations
What is LaTex Rendering?
LaTeX 渲染是指将包含排版指令和命令的 LaTeX 标记语言转换为格式化输出的过程。此输出通常是高质量文档、数学公式、科学论文或具有精确且一致排版的技术报告。
LaTeX rendering refers to the process of converting LaTeX markup language which contains typesetting instructions and commands, into formatted output. This output is typically high-quality documents, mathematical formulas, scientific papers or technical reports with precise and consistent typography.
LaTeX 渲染广泛应用于学术界、科学研究、技术文档和出版中,因为它具有强大的排版功能,并且能够生成专业外观的文档。
LaTeX rendering is widely used in academia, scientific research, technical documentation and publishing due to its robust typesetting capabilities and its ability to produce professional-looking documents.
Key Aspects of LaTeX Rendering
Typesetting - LaTeX 以其卓越的排版功能而闻名,确保了学术和技术内容的专业级文档格式。
Typesetting − LaTeX is renowned for its superior typesetting capabilities ensuring professional-grade document formatting for academic and technical content.
Mathematical Formulas - LaTeX 因其在排版复杂数学方程方面的出色支持而被广泛使用,使其成为学术和科学出版的首选。
Mathematical Formulas − LaTeX is extensively used for its exceptional support in typesetting complex mathematical equations by making it a preferred choice for academic and scientific publications.
Markup Language - LaTeX 使用标记语言,其中用户使用纯文本编写文档,并包含命令以指定格式、结构和内容。
Markup Language − LaTeX uses a markup language in which, where users write documents with plain text and include commands to specify formatting, structure and content.
Compilation - LaTeX 源代码需要使用 LaTeX 编译器(如 pdflatex、xelatex、lualatex)进行编译。在编译过程中,编译器解释 LaTeX 命令,并生成各种格式(如 PDF、DVI 或 PostScript)的最终输出。
Compilation − The LaTeX source code needs to be compiled using a LaTeX compiler such as pdflatex, xelatex, lualatex. During compilation the compiler interprets the LaTeX commands and generates the final output in various formats like PDF, DVI or PostScript.
Customization - LaTeX 允许用户创建自定义样式、模板和包,从而能够精确控制文档格式和布局。
Customization − LaTeX allows users to create custom styles, templates and packages by enabling precise control over document formatting and layout.
Benefits of LaTeX Rendering
Quality and Consistency - LaTeX 确保在各种平台和设备上进行高质量和一致的文档格式。
Quality and Consistency − LaTeX ensures high-quality and consistent document formatting across various platforms and devices.
Mathematical Typesetting - 它擅长处理复杂的数学符号,使其对于科学和数学内容不可或缺。
Mathematical Typesetting − It excels in handling complex mathematical notation and making it indispensable for scientific and mathematical content.
Cross-Platform Compatibility - LaTeX 文档可以在不同的操作系统上轻松编译和查看。
Cross-Platform Compatibility − LaTeX documents can be easily compiled and viewed on different operating systems.
Version Control - 基于纯文本的源文件简化了版本控制系统,使协作和文档历史管理变得更加容易。
Version Control − Plain text-based source files facilitate version control systems by making collaboration and document history management easier.
Enabling Latex Rendering
为了启用 LaTeX 渲染以便创建文档、公式或注释,我们通常需要以下内容。
To enable LaTeX rendering for creating documents, equations or annotations we typically need the following.
LaTeX Installation
安装包含必要的 LaTeX 编译器和软件包的 LaTeX 发行版,如 TeX Live、MiKTeX 或 MacTeX。
Install a LaTeX distribution like TeX Live, MiKTeX or MacTeX which includes the necessary LaTeX compiler and packages.
Text Editor
选择一个支持 LaTeX 的文本编辑器或集成开发环境 (IDE),如 TeXstudio、TeXworks、Overleaf 或带 LaTeX 插件/扩展的编辑器,如 Sublime Text、VS Code 或 Atom。
Choose a text editor or an integrated development environment (IDE) that supports LaTeX such as TeXstudio, TeXworks, Overleaf or editors like Sublime Text, VS Code or Atom with LaTeX plugins/extensions.
Write LaTeX Code
创建一个 .tex 文件,并使用适当的命令和语法来编写 LaTeX 代码,以构造包含公式或格式化文本的文档。
Create a .tex file and write LaTeX code using the appropriate commands and syntax to structure our document which include equations or format text.
Compilation
使用 LaTeX 编译器将此 .tex 文件编译成目标输出格式,如 PDF、DVI 和 PS。在终端中运行适当的命令,或使用所选编辑器/IDE 的集成功能。
Use the LaTeX compiler to compile the .tex file into the desired output format such as PDF, DVI, PS. Run the appropriate command in the terminal or use the integrated features of our chosen editor/IDE.
例如,在终端中,我们可以运行以下代码。
For example in a terminal we might run the following code.
pdflatex your_file.tex或者,在编辑器/IDE 中,通常会有 Compile 或 Build 按钮来启动编译进程。
Or within an editor/IDE there’s often a Build or Compile button to initiate the compilation process.
LaTeX Rendering in Matplotlib for Annotations
对于使用 LaTeX 格式化绘图中的文本的 Matplotlib 注释,我们必须确保以下内容。
For Matplotlib annotations using LaTeX for text formatting within plots we have to ensure the below.
-
Matplotlib 支持使用文本注释或类似函数中的 LaTeX 语法进行 LaTeX 注释。
Matplotlib Support − Matplotlib supports LaTeX for annotations by using LaTeX syntax within plt.annotate() or similar functions.
-
确保我们的系统上有 Matplotlib 能够访问的 LaTeX 安装程序,以渲染注释中的 LaTeX 文本。
LaTeX Installation − Ensure we have a working LaTeX installation on our system that Matplotlib can access for rendering LaTeX text within annotations.
-
在注释的 Matplotlib 函数中使用正确的 LaTeX 语法,以渲染目标 LaTeX 格式化的文本。
Correct Syntax − Use the correct LaTeX syntax r'$…$' within Matplotlib functions for annotations to render the desired LaTeX-formatted text.
通过遵循上述步骤,我们可以出于多种目的启用 LaTeX 渲染,如文档创建、数学符号或可视化库(如 Matplotlib)中的注释。
By following the above mentioned steps we can enable LaTeX rendering for various purposes such as document creation, mathematical notation or annotations in visualization libraries like Matplotlib.
Enabling LaTex Rendering
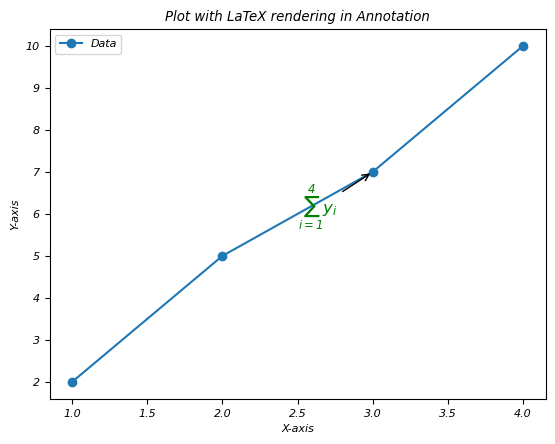
在此示例中,我们将在绘图的注释中使用 LaTex 渲染。
In this example we are going to use the LaTex rendering in the annotations of the plot.
import matplotlib.pyplot as plt
# Sample data
x = [1, 2, 3, 4]
y = [2, 5, 7, 10]
plt.plot(x, y, 'o-', label='Data')
# Annotating a point with LaTeX-rendered text
plt.annotate(r'$\sum_{i=1}^{4} y_i$',   # LaTeX expression within the annotation
   xy=(x[2], y[2]),           # Coordinates of the annotation point
   xytext=(2.5, 6),           # Text position
   arrowprops=dict(facecolor='black', arrowstyle='->'),
   fontsize=12,
   color='green')
# Labeling axes and title
plt.xlabel('X-axis')
plt.ylabel('Y-axis')
plt.title('Plot with LaTeX rendering in Annotation')
plt.legend()
plt.show()
执行上述代码时,您将获得以下输出 -
On executing the above code you will get the following output −

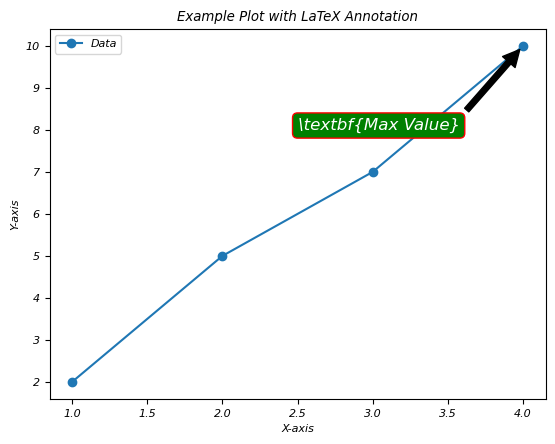
这里有另一个在绘图注释中使用 LaTex 渲染的示例。
Here this is another example of using the LaTex rendering in annotations of a plot.
import matplotlib.pyplot as plt
# Generating some data points
x = [1, 2, 3, 4]
y = [2, 5, 7, 10]
plt.plot(x, y, 'o-', label='Data')
# Annotating a point with LaTeX rendering
plt.annotate(r'\textbf{Max Value}',
   xy=(x[y.index(max(y))], max(y)),
   xytext=(2.5, 8),
   arrowprops=dict(facecolor='black', shrink=0.05),
   fontsize=12,
   color='white',
   bbox=dict(boxstyle='round,pad=0.3', edgecolor='red', facecolor='green'))
plt.xlabel('X-axis')
plt.ylabel('Y-axis')
plt.title('Example Plot with LaTeX Annotation')
plt.legend()
plt.show()
执行上述代码时,您将获得以下输出 -
On executing the above code you will get the following output −

Change the axis tick font in a Matplotlib plot when rendering using LaTex
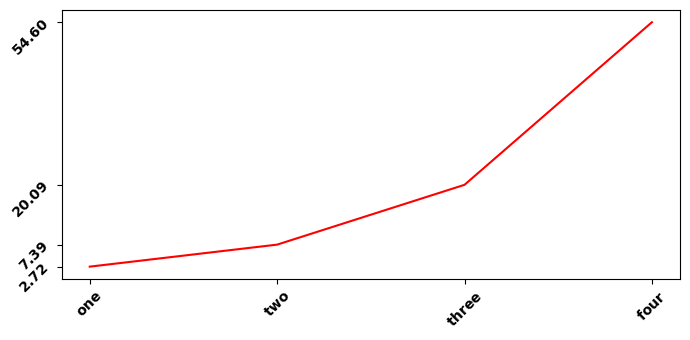
这是使用 LaTeX 渲染时更改 matplotlib 中刻度标签字体的一个示例。
Here this is the example to change the axis tick font in matplotlib when rendering using LaTeX
import numpy as np
import matplotlib.pyplot as plt
plt.rcParams["figure.figsize"] = [7.00, 3.50]
plt.rcParams["figure.autolayout"] = True
x = np.array([1, 2, 3, 4])
y = np.exp(x)
ax1 = plt.subplot()
ax1.set_xticks(x)
ax1.set_yticks(y)
ax1.plot(x, y, c="red")
ax1.set_xticklabels([r"$\bf{one}$", r"$\bf{two}$", r"$\bf{three}$", r"$\bf{four}$"], rotation=45)
ax1.set_yticklabels([r"$\bf{:.2f}$".format(y[0]), r"$\bf{:.2f}$".format(y[1]),
   r"$\bf{:.2f}$".format(y[2]), r"$\bf{:.2f}$".format(y[3])], rotation=45)
plt.tight_layout()
plt.show()
执行上述代码时,您将获得以下输出 -
On executing the above code you will get the following output −
