Matplotlib 简明教程
Matplotlib - Ellipse with Units
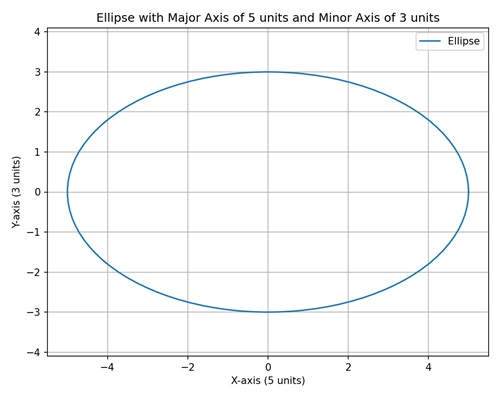
椭圆是一种看起来像拉伸的圆的几何形状。其由两个关键属性定义:其主轴(最长直径)及其短轴(最短直径)。这些轴在椭圆的中心相交,椭圆的形状由这些轴的长度决定。从中心到主轴边缘的距离和从中心到短轴边缘的距离都很重要。
An ellipse is a geometric shape that looks like a stretched circle. It is defined by two key properties: its major axis (the longest diameter) and its minor axis (the shortest diameter). These axes intersect at the center of the ellipse, and the shape of an ellipse is determined by the lengths of these axes. Both the distance from the center to the edge along the major axis and the distance from the center to the edge along the minor axis are important.
在单位方面,您将使用某种单位(如英寸、厘米或您选择的任何其他度量)来测量这些距离。所以,当我们使用单位说明椭圆时,我们的意思是使用特定度量(单位)来描述椭圆的大小,要考虑主轴长度和短轴长度。
In terms of units, you would measure these distances using some kind of unit, like inches, centimeters, or any other measurement you choose. So, when we say an ellipse with units, we mean that we are using specific measurements (units) to describe the size of the ellipse, considering both the length of the major axis and the length of the minor axis.
Ellipse with Units in Matplotlib
我们可以使用“matplotlib.patches”模块中的“Ellipse”类,在 Matplotlib 中创建带有单位的椭圆。Ellipse 类允许您定义椭圆的中心、宽度和高度(主轴和短轴)、旋转角以及椭圆的其他属性,例如其旋转角。
We can create an ellipse with units in Matplotlib using the "Ellipse" class in the "matplotlib.patches" module. The Ellipse class allows you to define the center, width and height (major and minor axes), angle of rotation, and other properties of the ellipse such as its rotation angle.
轴的测量单位取决于您使用的坐标系。例如,如果您使用的是英寸中的绘图,则主轴和短轴长度将以英寸为单位。
The units of measurement for the axes depend on the coordinate system you are using. For example, if you are working with a plot in inches, the major and minor axes lengths would be in inches.
Fixed Size Ellipse in Data Coordinates
在 Matplotlib 中,创建数据坐标中固定大小的椭圆涉及按数据坐标绘制特定大小和位置的椭圆。这意味着椭圆的尺寸按照您实际数据的单位指定。
In Matplotlib, creating a fixed size ellipse in data coordinates involves drawing an ellipse on a plot with a specific size and position determined by data coordinates. This means that the dimensions of the ellipse are specified in the same units as your actual data.
例如,如果你的数据集具有 x 和 y 值,你可以绘制一个椭圆,其中心位于特定点 (x, y) 上,而椭圆的宽度和高度则依照数据坐标来定义。
For instance, if you have a dataset with x and y values, you can draw an ellipse where the center is located at a particular (x, y) point, and the width and height of the ellipse are defined in terms of the data coordinates.
Example
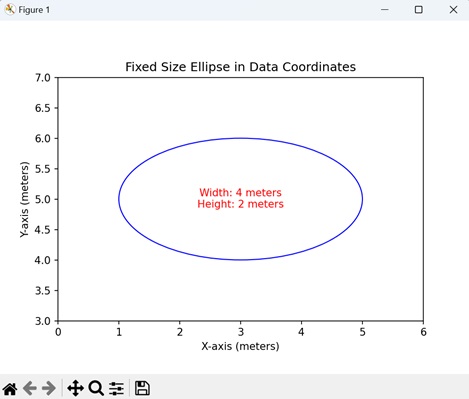
我们在数据坐标中绘制一个固定尺寸的简单椭圆。椭圆的中心位于图上的 (3, 5),宽度设置为“4”单位(米),而高度设置为“2”单位 -
we are drawing a simple ellipse with a fixed size specified in data coordinates. The center of the ellipse is located at (3, 5) on the plot, and the width is set to "4" units in meters, while the height is set to "2" units −
import matplotlib.pyplot as plt
from matplotlib.patches import Ellipse

# Creating a plot
fig, ax = plt.subplots()

# Ellipse in data coordinates (units: meters)
ellipse = Ellipse((3, 5), width=4, height=2, edgecolor='b', facecolor='none')
ax.add_patch(ellipse)

# Setting plot title and labels
ax.set_title('Fixed Size Ellipse in Data Coordinates')
ax.set_xlabel('X-axis (meters)')
ax.set_ylabel('Y-axis (meters)')

# Setting aspect ratio to 'equal'
ax.set_aspect('equal')

# Adjusting axis limits
ax.set_xlim(0, 6)
ax.set_ylim(3, 7)

# Displaying dimensions
plt.text(3, 5, f'Width: 4 meters\nHeight: 2 meters', ha='center', va='center', color='red', fontsize=10)
plt.show()
以下是上面代码的输出: -
Following is the output of the above code −
Ellipse with Variable Size in Axes Coordinates
在 Matplotlib 中以轴坐标创建可变大小的椭圆包括在图上绘制一个椭圆,其中维度是根据轴而不是实际数据来指定的。换句话说,椭圆的宽度和高度分别给出为 x 轴和 y 轴总长度的百分比。
Creating an ellipse with variable size in axes coordinates in Matplotlib involves drawing an ellipse on a plot where the dimensions are specified in terms of the axes, rather than the actual data. In other words, the width and height of the ellipse are given as a percentage of the total length of the x and y axes, respectively.
例如,如果你想绘制一个椭圆,它总是覆盖 x 轴的 60% 和 y 轴的 30%,而不考虑特定的数据值,则可以使用轴坐标。当你想让椭圆的大小相对于图的整体维度时,这一点尤其有用。
For example, if you want to visualize an ellipse that always covers 60% of the x-axis and 30% of the y-axis, regardless of the specific data values, you can use axes coordinates. This is particularly useful when you want the size of the ellipse to be relative to the overall dimensions of the plot.
Example
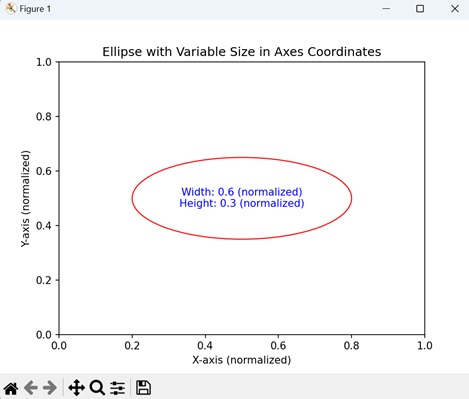
在这里,我们绘制了一个轴坐标中指定的可变大小的椭圆。椭圆的中心放置在 (0.5, 0.5) 处,这对应于图的中心。宽度和高度分别设置为各自轴长度的 60% 和 30%,使椭圆能够随着轴的变化而缩放 -
In here, we are drawing a an ellipse with a variable size specified in axes coordinates. The center of the ellipse is placed at (0.5, 0.5), which corresponds to the center of the plot. The width and height are set to 60% and 30% of the respective axis lengths, allowing the ellipse to scale with changes in the axes −
import matplotlib.pyplot as plt
from matplotlib.patches import Ellipse

# Creating a plot
fig, ax = plt.subplots()

# Ellipse in axes coordinates
ellipse = Ellipse((0.5, 0.5), width=0.6, height=0.3, edgecolor='r', facecolor='none', transform=ax.transAxes)
ax.add_patch(ellipse)

# Setting plot title and labels
ax.set_title('Ellipse with Variable Size in Axes Coordinates')
ax.set_xlabel('X-axis (normalized)')
ax.set_ylabel('Y-axis (normalized)')

# Displaying dimensions in the output
plt.text(0.5, 0.5, f'Width: 0.6 (normalized)\nHeight: 0.3 (normalized)', ha='center', va='center', color='blue', fontsize=10, transform=ax.transAxes)
plt.show()
执行上述代码,我们将得到以下输出 −
On executing the above code we will get the following output −
Ellipse Centered at Figure Origin
在 Matplotlib 中创建以图形原点为中心的椭圆包括在图上绘制一个椭圆,其中心位于整个图形的原点上。原点是图形坐标系中的点 (0, 0)。在这种情况下,椭圆的宽度和高度以图形的单位指定,并且椭圆的中心恰好在原点上。
Creating an ellipse centered at figure origin in Matplotlib involves drawing an ellipse on a plot with its center positioned at the origin of the entire figure. The origin is the point (0, 0) in the coordinate system of the figure. In this case, the width and height of the ellipse are specified in the units of the figure, and the center of the ellipse is precisely at the origin.
这演示了如何相对于整体图形而不是各个轴放置椭圆。
This demonstrates how to position an ellipse with respect to the overall figure rather than the individual axes.
Example
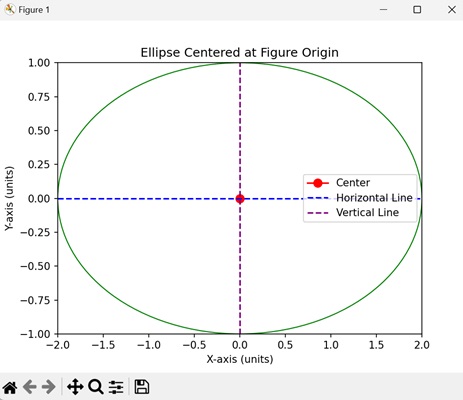
在下面的示例中,我们在图形的原点 (0, 0) 处创建了一个椭圆。宽度设置为 4 个单位,高度设置为 2 个单位 -
In the example below, we are creating an ellipse with its center at the origin of the figure (0, 0). The width is set to 4 units, and the height is set to 2 units −
import matplotlib.pyplot as plt
from matplotlib.patches import Ellipse
import numpy as np

# Creating a plot
fig, ax = plt.subplots()

# Ellipse centered at figure origin
ellipse = Ellipse((0, 0), width=4, height=2, edgecolor='g', facecolor='none', transform=ax.transData)
ax.add_patch(ellipse)

# Marking the center with a marker
center_x, center_y = 0, 0
ax.plot(center_x, center_y, marker='o', markersize=8, color='red', label='Center')

# Dotted line to represent the center
ax.plot([center_x, center_x], [center_y, center_y], 'r--')

# Horizontal and vertical lines passing through the center
ax.axhline(center_y, color='blue', linestyle='--', label='Horizontal Line')
ax.axvline(center_x, color='purple', linestyle='--', label='Vertical Line')

# Setting plot title and labels
ax.set_title('Ellipse Centered at Figure Origin')
ax.set_xlabel('X-axis (units)')
ax.set_ylabel('Y-axis (units)')

# Adjusting axis limits to make the ellipse and lines visible
ax.set_xlim(-2, 2)
ax.set_ylim(-1, 1)

# Adding legend
ax.legend()
plt.show()
执行上面的代码后,我们得到以下输出: -
After executing the above code, we get the following output −
Rotated Ellipse with Custom Angle
在 Matplotlib 中创建具有自定义角度的旋转椭圆包括在图上绘制一个椭圆,并指定一个自定义角度来旋转它。旋转角度决定了椭圆在图中如何倾斜或旋转。当你想突出显示特定方向中的特征时,这很有用。
Creating a rotated ellipse with custom angle in Matplotlib involves drawing an ellipse on a plot and specifying a custom angle to rotate it. The rotation angle determines how the ellipse is tilted or turned within the plot. This is useful when you want to highlight features in a specific orientation.
Example
现在,我们创建了一个旋转椭圆,其自定义角度为“45”度,从而产生了倾斜一定角度的椭圆。椭圆的中心位于 (2, 3),并且宽度和高度以数据坐标指定 -
Now, we are creating a rotated ellipse with a custom angle of "45" degrees, resulting in an ellipse tilted at an angle. The center of the ellipse is located at (2, 3), and the width and height are specified in data coordinates −
import matplotlib.pyplot as plt
from matplotlib.patches import Ellipse

# Creating a plot
fig, ax = plt.subplots()

# Rotated ellipse with custom angle
ellipse = Ellipse((2, 3), width=3, height=1, angle=45, edgecolor='purple', facecolor='none', transform=ax.transData)
ax.add_patch(ellipse)

# Setting plot title and labels
ax.set_title('Rotated Ellipse with Custom Angle')
ax.set_xlabel('X-axis (units)')
ax.set_ylabel('Y-axis (units)')

# Setting aspect ratio to 'equal'
ax.set_aspect('equal')

# Adjusting axis limits
ax.set_xlim(0, 4)
ax.set_ylim(2, 5)

# Adding grid for better visualization
ax.grid(True, linestyle='--', alpha=0.7)
plt.show()
执行上述代码,我们将得到以下输出 −
On executing the above code we will get the following output −
